Get certified for free when you join Fabric Data Days 2026 and dive into Fabric, Power BI, SQL, AI, and other essential data skills.
Join nowJuly 7 - July 17 | Round 2 of the Power BI Dataviz World Championships. Don't miss your chance! Learn more
Hello guys, thanks in advance
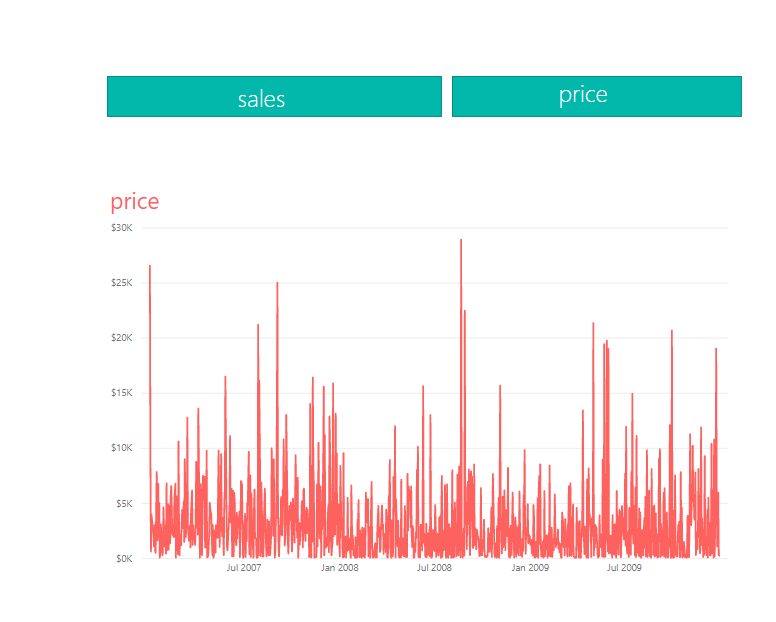
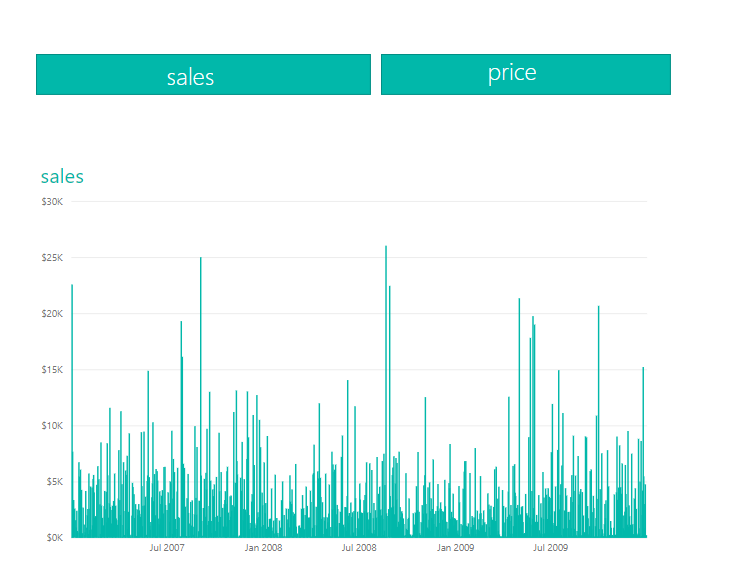
I want to switch visualization by drop-down list, i made it by buttons and bookmarks but businesses need it as a dropdown list
Nice day.
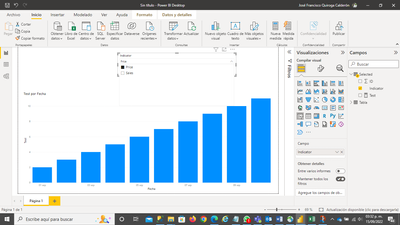
To do this you must a new table that contains the indicators to select in the drop-down combo and make a nested switch measurement with Selectedvalue to return that value, I leave you an example, I hope it helps you.
Best regards.
Thanks for this solution, can u please send to me the power bi file
and if I want to make this with two different charts such as a line chart and a bar chart, is can do it with this method?
Good day dear,
Disulpate the response time, I share a link with an example, I hope it is useful.
https://drive.google.com/file/d/1WK7rVPlXan2EiB7FxDYf6Gz73wixFlud/view?usp=sharing
Best regards.
Join us in Barcelona for FabCon and SQLCon, the Fabric, Power BI, SQL, and AI community event. Save €200 with code FABCMTY200.
Join Fabric Data Days 2026: 60 days of free live/on-demand sessions, challenges, study groups, and certification opportunities.
| User | Count |
|---|---|
| 27 | |
| 24 | |
| 18 | |
| 14 | |
| 14 |
| User | Count |
|---|---|
| 65 | |
| 41 | |
| 40 | |
| 39 | |
| 39 |