cancel
Showing results for 
Search instead for 
Did you mean: 

July 7 - July 17 | Round 2 of the Power BI Dataviz World Championships. Don't miss your chance! Learn more

Reply
PhilipH
New Member

StdDev By Subgroups

Hi guys,


I am hoping you can help as I am going in circles.


I am looking to calculate the stdev for a [data] column, grouped according to a [VarFtrID] column and then a [Sequence] column. 


If I put a Card on the Report page how can I get it to display the stddev correctly? I can use a slicer to select the correct [VarFtrID] but then my data is sometimes subgrouped, where the same [Sequence] number will be repeated throughout the subgroup.


Any help greatly appreciated.

1 ACCEPTED SOLUTION
Anonymous
Not applicable

Hi  @PhilipH ,

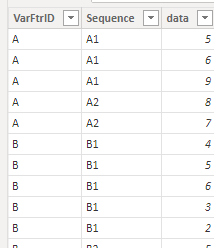
I created some data:

vyangliumsft_0-1656552548943.png

Here are the steps you can follow:

1. Create calculated column.

The standard deviation of the entire population

the standard deviation of the entire population =
CALCULATE(STDEV.P('Table'[data]),FILTER(ALL('Table'),'Table'[VarFtrID]=EARLIER('Table'[VarFtrID])&&'Table'[Sequence]=EARLIER('Table'[Sequence])))

Refer to :

STDEV.P function (DAX) - DAX | Microsoft Docs


The standard deviation of a sample population

the standard deviation of a sample population. = CALCULATE(STDEV.S('Table'[data]),FILTER(ALL('Table'),'Table'[VarFtrID]=EARLIER('Table'[VarFtrID])&&'Table'[Sequence]=EARLIER('Table'[Sequence])))

Refer to :

STDEV.S function (DAX) - DAX | Microsoft Docs


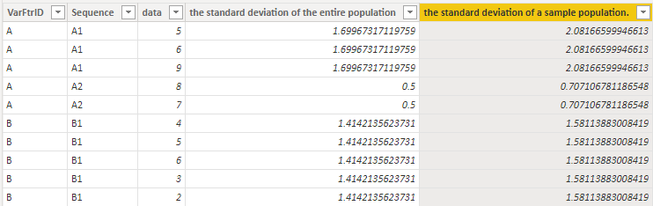
2. Result:

vyangliumsft_1-1656552548945.png


Best Regards,

Liu Yang

If this post helps, then please consider Accept it as the solution to help the other members find it more quickly

View solution in original post

2 REPLIES 2
Anonymous
Not applicable

Hi  @PhilipH ,

I created some data:

vyangliumsft_0-1656552548943.png

Here are the steps you can follow:

1. Create calculated column.

The standard deviation of the entire population

the standard deviation of the entire population =
CALCULATE(STDEV.P('Table'[data]),FILTER(ALL('Table'),'Table'[VarFtrID]=EARLIER('Table'[VarFtrID])&&'Table'[Sequence]=EARLIER('Table'[Sequence])))

Refer to :

STDEV.P function (DAX) - DAX | Microsoft Docs


The standard deviation of a sample population

the standard deviation of a sample population. = CALCULATE(STDEV.S('Table'[data]),FILTER(ALL('Table'),'Table'[VarFtrID]=EARLIER('Table'[VarFtrID])&&'Table'[Sequence]=EARLIER('Table'[Sequence])))

Refer to :

STDEV.S function (DAX) - DAX | Microsoft Docs


2. Result:

vyangliumsft_1-1656552548945.png


Best Regards,

Liu Yang

If this post helps, then please consider Accept it as the solution to help the other members find it more quickly

Thank you for your reply. The built in formula are slightly different to the calcs we need to use so I think I will need to manually calculate it. I think I've got the dev_sq_sum bit wrong though. This is to show the value per row according to subgoup in a chart
 
STDEV =
var x_sum = CALCULATE(SUM('VarData'[data]),FILTER(ALL('VarData'),'VarData'[VarFtrID]=EARLIER('VarData'[VarFtrID])))
var x_count = CALCULATE(COUNT('VarData'[data]),FILTER(ALL('VarData'),'VarData'[VarFtrID]=EARLIER('VarData'[VarFtrID])))
VAR mean = (x_sum / x_count)
VAR dev_sq_sum = CALCULATE(sumx('VarData',POWER(VarData[Data] - mean, 2)),FILTER(ALL('VarData'),'VarData'[VarFtrID]=EARLIER('VarData'[VarFtrID])))
VAR std_dev = SQRT(dev_sq_sum/(x_count-1))

Helpful resources

Announcements
FabCon and SQLCon Barcelona 2026

FabCon & SQLCon – Barcelona 2026

Join us in Barcelona for FabCon and SQLCon, the Fabric, Power BI, SQL, and AI community event. Save €200 with code FABCMTY200.

July Power BI Update Carousel

Power BI Monthly Update - July 2026

Check out the July 2026 Power BI update to learn about new features.

60 days of Data Days Carousel

Data Days 2026

Join Data Days 2026: 60 days of free live/on-demand sessions, challenges, study groups, and certification opportunities.

Power BI DataViz World Championships carousel

Power BI DataViz World Championships - June 2026

A new Power BI DataViz World Championship is coming this June! Don't miss out on submitting your entry.

Top Solution Authors