Join us at FabCon Vienna from September 15-18, 2025
The ultimate Fabric, Power BI, SQL, and AI community-led learning event. Save €200 with code FABCOMM.
Get registered- Power BI forums
- Get Help with Power BI
- Desktop
- Service
- Report Server
- Power Query
- Mobile Apps
- Developer
- DAX Commands and Tips
- Custom Visuals Development Discussion
- Health and Life Sciences
- Power BI Spanish forums
- Translated Spanish Desktop
- Training and Consulting
- Instructor Led Training
- Dashboard in a Day for Women, by Women
- Galleries
- Data Stories Gallery
- Themes Gallery
- Contests Gallery
- Quick Measures Gallery
- Notebook Gallery
- Translytical Task Flow Gallery
- TMDL Gallery
- R Script Showcase
- Webinars and Video Gallery
- Ideas
- Custom Visuals Ideas (read-only)
- Issues
- Issues
- Events
- Upcoming Events
Compete to become Power BI Data Viz World Champion! First round ends August 18th. Get started.
- Power BI forums
- Forums
- Get Help with Power BI
- Desktop
- Re: Static values in a graph
- Subscribe to RSS Feed
- Mark Topic as New
- Mark Topic as Read
- Float this Topic for Current User
- Bookmark
- Subscribe
- Printer Friendly Page
- Mark as New
- Bookmark
- Subscribe
- Mute
- Subscribe to RSS Feed
- Permalink
- Report Inappropriate Content
Static values in a graph
Hi there,
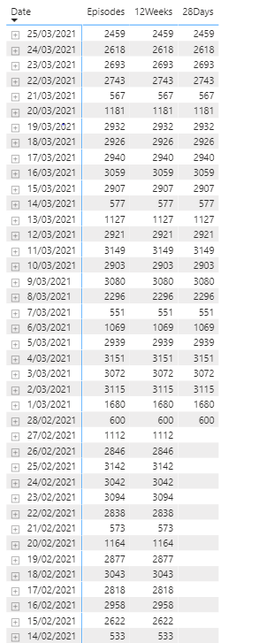
I am trying to show a graph with static values and dynamic values adjusted by a slider int he same graph. The image below has sample data showing the static 28 days and dynamic episodes.
Thanks
N
Solved! Go to Solution.
- Mark as New
- Bookmark
- Subscribe
- Mute
- Subscribe to RSS Feed
- Permalink
- Report Inappropriate Content
Hi amitchandak,
I figured it out. I created a second date table using the calendar(min(date[date]), max(date[date])) of the first table. Then created a last date field in the new date table using the TODAY() function. I then used the last date on the two measures above to make them static. Finally i used the second date table as the slide filter, see adjusted caculated fields.
Static fields:
12 weeks =
var _max = maxx(ALLSELECTED('Date2'),'Date2'[LastDate])
var _min = maxx(ALLSELECTED('Date2'),'Date2'[LastDate]) - 12*7
return
calculate([Episodes], filter(Date, Date[Date] >=Min && 'Date'[Date] <=Max ))
28 Days =
var _max = maxx(ALLSELECTED('Date2'),'Date2'[LastDate])
var _min = MAxx(ALLSELECTED('Date2'),'Date2'[LastDate]) - 28
return
calculate([Episodes], filter(Date, Date[Date] >=Min && 'Date'[Date] <=Max ))
Dynamic field:
Episodes =
var _max = maxx(ALLSELECTED('Date2'),'Date2'[Date])
var _min = Minx(ALLSELECTED('Date2'),'Date2'[Date])
return
calculate([Episodes], filter(Date, Date[Date] >=Min && 'Date'[Date] <=Max ))
Thanks for the initial idea of the two measures.
N
- Mark as New
- Bookmark
- Subscribe
- Mute
- Subscribe to RSS Feed
- Permalink
- Report Inappropriate Content
Hi amitchandak,
Thanks for this. it partially worked. I was wondering if the two field of 12 weeks and 28 days would remain static if i selected date ranges before 12 weeks. At the moment they seem to disappear if i select date ranges before begining of this year as the last date.
Thanks
N
- Mark as New
- Bookmark
- Subscribe
- Mute
- Subscribe to RSS Feed
- Permalink
- Report Inappropriate Content
@ngiom , Try two new measures , Assuming you are using Episodes as measure and Date from Date table on Rows of matrix
12 weeks =
var _max = maxx(ALLSELECTED('Date'),'Date'[Date])
var _min = maxx(ALLSELECTED('Date'),'Date'[Date]) - 12*7
return
calculate([Episodes], filter(Date, Date[Date] >=Min && 'Date'[Date] <=Max ))
28 Days =
var _max = maxx(ALLSELECTED('Date'),'Date'[Date])
var _min = MAxx(ALLSELECTED('Date'),'Date'[Date]) - 28
return
calculate([Episodes], filter(Date, Date[Date] >=Min && 'Date'[Date] <=Max ))
To get the best of the time intelligence function. Make sure you have a date calendar and it has been marked as the date in model view. Also, join it with the date column of your fact/s. Refer :radacad sqlbi My Video Series Appreciate your Kudos.
- Mark as New
- Bookmark
- Subscribe
- Mute
- Subscribe to RSS Feed
- Permalink
- Report Inappropriate Content
Hi amitchandak,
I figured it out. I created a second date table using the calendar(min(date[date]), max(date[date])) of the first table. Then created a last date field in the new date table using the TODAY() function. I then used the last date on the two measures above to make them static. Finally i used the second date table as the slide filter, see adjusted caculated fields.
Static fields:
12 weeks =
var _max = maxx(ALLSELECTED('Date2'),'Date2'[LastDate])
var _min = maxx(ALLSELECTED('Date2'),'Date2'[LastDate]) - 12*7
return
calculate([Episodes], filter(Date, Date[Date] >=Min && 'Date'[Date] <=Max ))
28 Days =
var _max = maxx(ALLSELECTED('Date2'),'Date2'[LastDate])
var _min = MAxx(ALLSELECTED('Date2'),'Date2'[LastDate]) - 28
return
calculate([Episodes], filter(Date, Date[Date] >=Min && 'Date'[Date] <=Max ))
Dynamic field:
Episodes =
var _max = maxx(ALLSELECTED('Date2'),'Date2'[Date])
var _min = Minx(ALLSELECTED('Date2'),'Date2'[Date])
return
calculate([Episodes], filter(Date, Date[Date] >=Min && 'Date'[Date] <=Max ))
Thanks for the initial idea of the two measures.
N


