Get certified for free when you join Fabric Data Days 2026 and dive into Fabric, Power BI, SQL, AI, and other essential data skills.
Join nowJuly 7 - July 17 | Round 2 of the Power BI Dataviz World Championships. Don't miss your chance! Learn more
Hi,
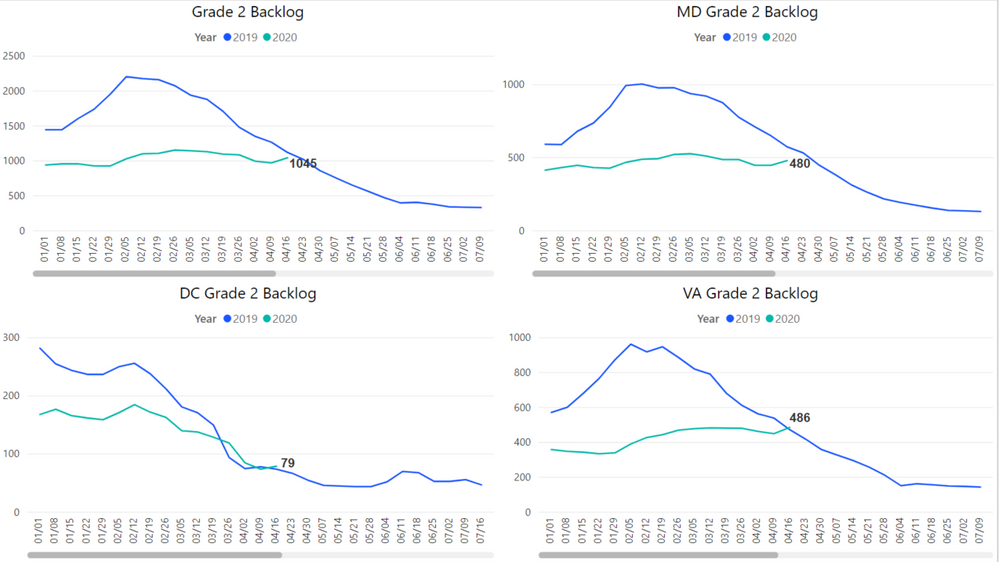
I am trying to display Weekly data, but when I try to fit multiple graphs onto one page, it does not shrink with the size of the graph like Excel does.
Is there a way to shrink the graph so there is no scroll bar on the bottom?
I have tried to display the graph monthly, but it thorws the data off...
Thank you!
Sarah
Solved! Go to Solution.
Hi @Anonymous,
I suggest you create an idea for it in Power BI forum and it will make this feature coming sooner:https://ideas.powerbi.com/forums/265200-power-bi-ideas.
If this post helps, then please consider Accept it as the solution to help the other members find it more quickly.
Best Regards,
Dedmon Dai
Hi @Anonymous,
I suggest you create an idea for it in Power BI forum and it will make this feature coming sooner:https://ideas.powerbi.com/forums/265200-power-bi-ideas.
If this post helps, then please consider Accept it as the solution to help the other members find it more quickly.
Best Regards,
Dedmon Dai
darn:(
Join us in Barcelona for FabCon and SQLCon, the Fabric, Power BI, SQL, and AI community event. Save €200 with code FABCMTY200.
Join Data Days 2026: 60 days of free live/on-demand sessions, challenges, study groups, and certification opportunities.
| User | Count |
|---|---|
| 28 | |
| 26 | |
| 26 | |
| 20 | |
| 16 |
| User | Count |
|---|---|
| 52 | |
| 49 | |
| 43 | |
| 38 | |
| 36 |