Get Fabric or SQL Certified for Free.
Get certified for free when you join Fabric Data Days 2026 and dive into Fabric, Power BI, SQL, AI, and other essential data skills.
Join now- Power BI forums
- Get Help with Power BI
- Desktop
- Service
- Report Server
- Power Query
- Mobile Apps
- Developer
- DAX Commands and Tips
- Custom Visuals Development Discussion
- Health and Life Sciences
- Power BI Spanish forums
- Translated Spanish Desktop
- Training and Consulting
- Instructor Led Training
- Dashboard in a Day for Women, by Women
- Galleries
- Data Stories Gallery
- Themes Gallery
- Contests Gallery
- QuickViz Gallery
- Quick Measures Gallery
- Visual Calculations Gallery
- Notebook Gallery
- Translytical Task Flow Gallery
- TMDL Gallery
- R Script Showcase
- Webinars and Video Gallery
- Ideas
- Custom Visuals Ideas (read-only)
- Issues
- Issues
- Events
- Upcoming Events
July 7 - July 17 | Round 2 of the Power BI Dataviz World Championships. Don't miss your chance! Learn more
- Power BI forums
- Forums
- Get Help with Power BI
- Desktop
- Re: Show Sub Total on Row
- Subscribe to RSS Feed
- Mark Topic as New
- Mark Topic as Read
- Float this Topic for Current User
- Bookmark
- Subscribe
- Printer Friendly Page

- Mark as New
- Bookmark
- Subscribe
- Mute
- Subscribe to RSS Feed
- Permalink
- Report Inappropriate Content
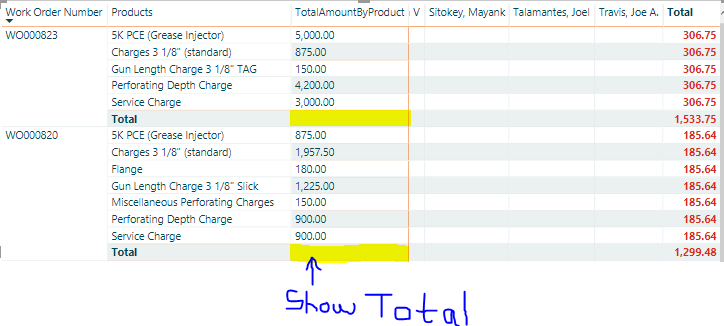
Show Sub Total on Row


- Mark as New
- Bookmark
- Subscribe
- Mute
- Subscribe to RSS Feed
- Permalink
- Report Inappropriate Content
Hi,
According to your description, I create a table to test:
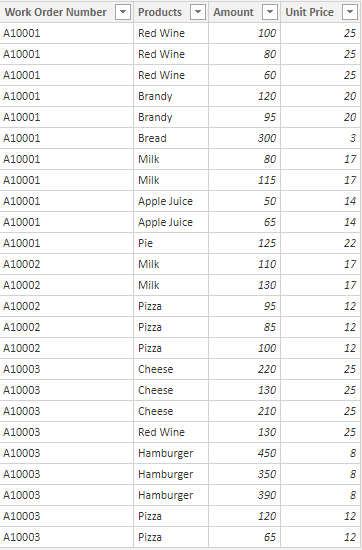
Then, create a column to calculate the total amount and put it in the row fields:
Total Amount by Product = CALCULATE(SUM('Table'[Amount]),ALLEXCEPT('Table','Table'[Products],'Table'[Work Order Number]))
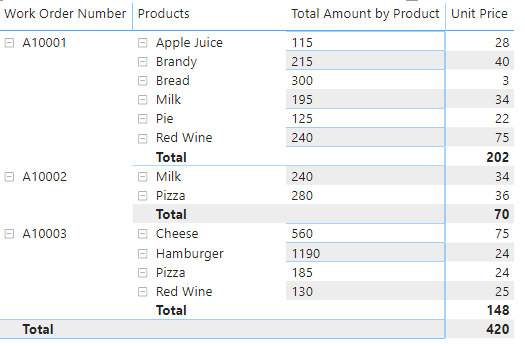
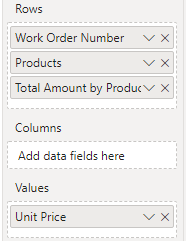
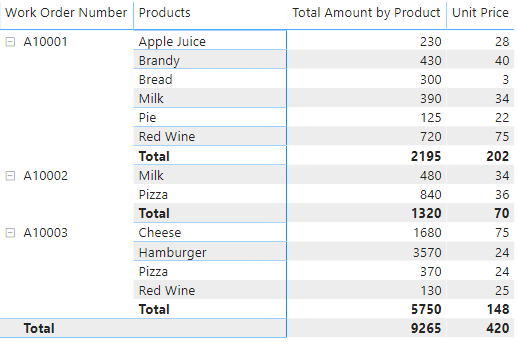
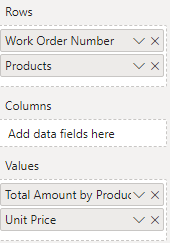
the reason why Power BI Desktop does not calculate the sum of total amount for each [Work Order Number] is that because this column is in the rows fields and you should put it in values fields.
So, I put this calculated column in values field, and it shows:
Here is my test pbix file:
Best Regards,
Giotto Zhi
- Mark as New
- Bookmark
- Subscribe
- Mute
- Subscribe to RSS Feed
- Permalink
- Report Inappropriate Content
Hi,
For your problem, I use a new table to test:
Please take following steps:
1)Create a measure to replace the column [TotalAmountByProduct]:
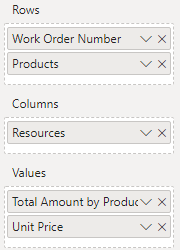
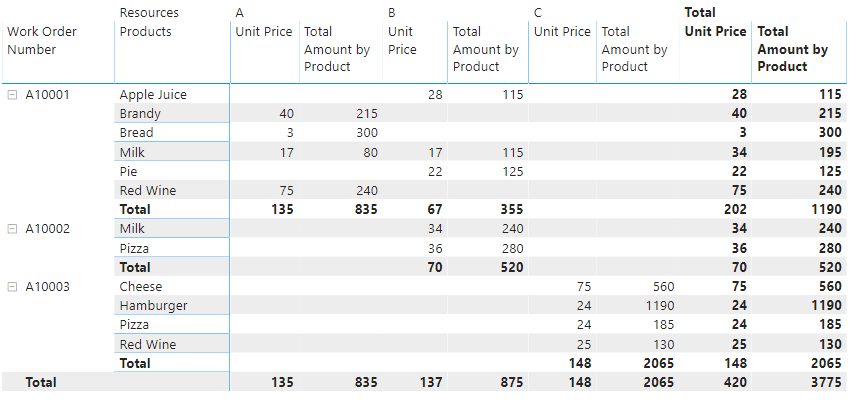
Total Amount by Product = SUM('Table'[Amount])2)Put this measure into Values field and it shows:
3)Turn off 'Word Wrap' in Format->Column headers and hide this measure under each resources, it shows:

Best Regards,
Giotto Zhi
- Mark as New
- Bookmark
- Subscribe
- Mute
- Subscribe to RSS Feed
- Permalink
- Report Inappropriate Content
Hi,
According to your description, I create a table to test:
Then, create a column to calculate the total amount and put it in the row fields:
Total Amount by Product = CALCULATE(SUM('Table'[Amount]),ALLEXCEPT('Table','Table'[Products],'Table'[Work Order Number]))
the reason why Power BI Desktop does not calculate the sum of total amount for each [Work Order Number] is that because this column is in the rows fields and you should put it in values fields.
So, I put this calculated column in values field, and it shows:
Here is my test pbix file:
Best Regards,
Giotto Zhi
- Mark as New
- Bookmark
- Subscribe
- Mute
- Subscribe to RSS Feed
- Permalink
- Report Inappropriate Content
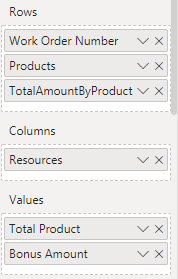
Thank you for your reply. I created new column. But my requirement is as follows:
1. I need to show
i. Work Order Number
ii. Products per Work Order Number
iii. Total Amount
iv. Resources worked on it
v. Bonus per Resource
vi. Total Bonus
vii. % Loss or Profit per Work Order Number
Therefore I have Resources in Columns. If I add Total Amount in Values it gets devided per resource and I dont want that. Kindly help me with this.
- Mark as New
- Bookmark
- Subscribe
- Mute
- Subscribe to RSS Feed
- Permalink
- Report Inappropriate Content
Hi,
For your problem, I use a new table to test:
Please take following steps:
1)Create a measure to replace the column [TotalAmountByProduct]:
Total Amount by Product = SUM('Table'[Amount])2)Put this measure into Values field and it shows:
3)Turn off 'Word Wrap' in Format->Column headers and hide this measure under each resources, it shows:
Best Regards,
Giotto Zhi
- Mark as New
- Bookmark
- Subscribe
- Mute
- Subscribe to RSS Feed
- Permalink
- Report Inappropriate Content
Thank you for your response.
How can I hide Total Amount for each resource as resources will change according to filters applied.
And how can I show % Revenue column at the end of matrix.
- Mark as New
- Bookmark
- Subscribe
- Mute
- Subscribe to RSS Feed
- Permalink
- Report Inappropriate Content
Hi,
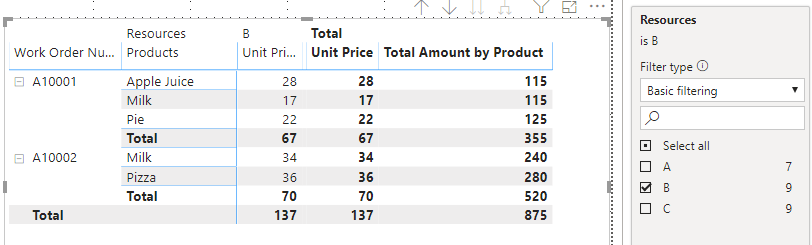
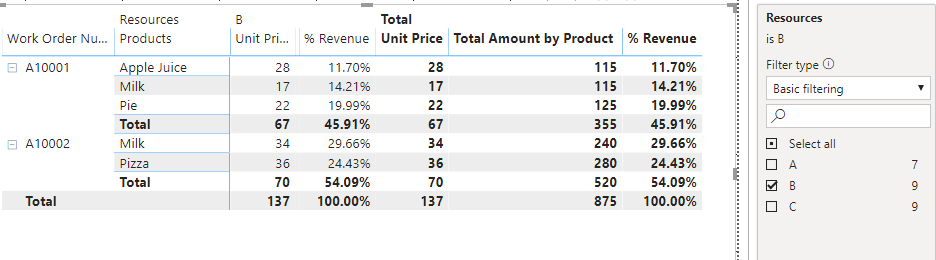
For your first problem, please select the visual and choose its Format->Column headers->Word wrap, then turn off it:

Then you can drag the columns you do not want to hide them:
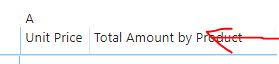


When you filter resources, it shows:
And for your second problem, please create a measure:
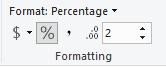
% Revenue = SUMX('table','Table'[Unit Price]*'Table'[Amount]) / CALCULATE(SUMX('table','Table'[Unit Price]*'Table'[Amount]),ALLSELECTED('Table'))Then, change its format:
And it shows:
Best Regards,
Giotto Zhi
- Mark as New
- Bookmark
- Subscribe
- Mute
- Subscribe to RSS Feed
- Permalink
- Report Inappropriate Content
Hello,
Thank you so much for quick and right support. It is helping me alot. I am thinking of displaying matrix as below.
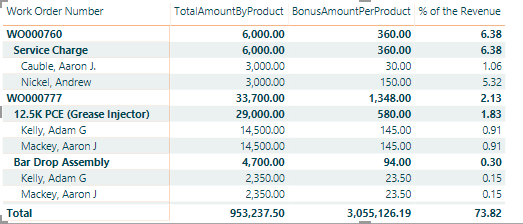
Here I dont want to show
1. Total Amount in front of Resources
2. And Total Bonus in front of Product is showing double (as it is calculated measure I am missing something)
Could you please help me with this.

Helpful resources

FabCon & SQLCon – Barcelona 2026
Join us in Barcelona for FabCon and SQLCon, the Fabric, Power BI, SQL, and AI community event. Save €200 with code FABCMTY200.

Data Days 2026
Join Data Days 2026: 60 days of free live/on-demand sessions, challenges, study groups, and certification opportunities.

Power BI DataViz World Championships - June 2026
A new Power BI DataViz World Championship is coming this June! Don't miss out on submitting your entry.

| User | Count |
|---|---|
| 26 | |
| 23 | |
| 19 | |
| 18 | |
| 15 |


| User | Count |
|---|---|
| 46 | |
| 44 | |
| 43 | |
| 36 | |
| 31 |


