This is best Fabric, Power BI, SQL and AI community event. How do we know? The last event sold out! Save €200 with code FABCMTY200.
Register nowThe Fabric community is upgrading! Read all of the details including the timeline and what you can expect. Learn more
When I import a text field from SQL into Power BI, I have a few options to show the text in a Matrix which allows me to have a MAtrix view like so:
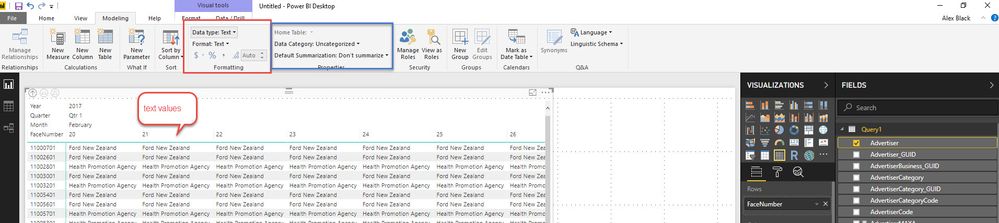
This is what I want. the aggregations available for the "Advertiser" column are First, Last, Count, Count (distinct). In the red box the field is of type Text and in the blue box it's uncategorised and dont summarise.
Compare the same field loaded into an SSAS Tabular Model Cube:
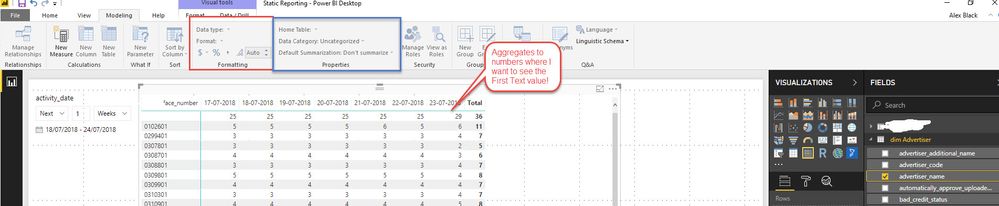
I only have the aggregations of Count, Count (Distinct) and in the red box it doesnt define a data type - it tried to make it a number all the time.
How do I define in my SSAS Tab Model to treat this field like Power BI does? I want to see the First Text in each column....
Solved! Go to Solution.
Hi cousinlarry ,
Based on your screenshot, you are connecting to SSAS with live connection mode, right? In live connection mode, you are not allowed to create calculate column or measure(if your model is multi-dimensional model) to achieve aggregation value. Please refer to this blog: https://community.powerbi.com/t5/Community-Blog/Power-BI-Live-connection-vs-Import-comparison-and-li....
In addtion, value in your column are text, so the aggregation way only can be "count of", you can select "Don't summarize" in the field of matrix chart.
Regards,
Jimmy Tao
Hi cousinlarry ,
Based on your screenshot, you are connecting to SSAS with live connection mode, right? In live connection mode, you are not allowed to create calculate column or measure(if your model is multi-dimensional model) to achieve aggregation value. Please refer to this blog: https://community.powerbi.com/t5/Community-Blog/Power-BI-Live-connection-vs-Import-comparison-and-li....
In addtion, value in your column are text, so the aggregation way only can be "count of", you can select "Don't summarize" in the field of matrix chart.
Regards,
Jimmy Tao
Join us in Barcelona for FabCon and SQLCon, the Fabric, Power BI, SQL, and AI community event. Save €200 with code FABCMTY200.
| User | Count |
|---|---|
| 24 | |
| 22 | |
| 20 | |
| 18 | |
| 14 |
| User | Count |
|---|---|
| 45 | |
| 38 | |
| 24 | |
| 22 | |
| 20 |