cancel
Showing results for 
Search instead for 
Did you mean: 

July 7 - July 17 | Round 2 of the Power BI Dataviz World Championships. Don't miss your chance! Learn more

Reply
villasenorbritt
Resolver I
Resolver I

SQL Views and BI

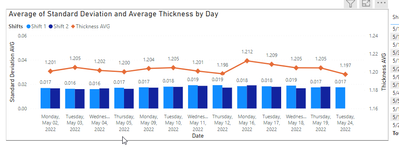
I am working with SQL to pull data into power bi. I made a view in SQL that has only what we consider "Good Data" and here is the table that represents that:

villasenorbritt_0-1653404198219.png

What I am stuck on is how to make a filter where they can see what we consider "not good" data. For example, if there was a piece of debris in the way of the sensor and it caused a miscalculation, I want them to be able to see that as well as it will determine if this is a continuous problem. How should I go about doing this? I'm a lot better with SQL so is it possible to create another view in SQL with the bad data and put that into a slicer? This community is the only place I can ever get accurate and helpful answers, so thank you in advance!


1 ACCEPTED SOLUTION
Anonymous
Not applicable

If i understood your question correctly, i will probably do the following:


Create a view with good and bad data, but add a column that (semething like "Data quality") that says if the current row is good data or bad data.

Then in Power BI you can filter your visuals using that field.


Hope it helps

View solution in original post

3 REPLIES 3
Anonymous
Not applicable

If i understood your question correctly, i will probably do the following:


Create a view with good and bad data, but add a column that (semething like "Data quality") that says if the current row is good data or bad data.

Then in Power BI you can filter your visuals using that field.


Hope it helps

Hey @Anonymous , I have another question that I think you might be able to help with. Lets say I am only wanting to show the "Good" data in my chart, but then I need the "Bad data" to be categorized into five different categories. How would you go about doing this?

@Anonymous See I knew someone on here would have a simpler, cleaner way to get this done. Thanks for your help!

Helpful resources

Announcements
FabCon and SQLCon Barcelona 2026

FabCon & SQLCon – Barcelona 2026

Join us in Barcelona for FabCon and SQLCon, the Fabric, Power BI, SQL, and AI community event. Save €200 with code FABCMTY200.

60 days of Data Days Carousel

Data Days 2026

Join Fabric Data Days 2026: 60 days of free live/on-demand sessions, challenges, study groups, and certification opportunities.

Power BI DataViz World Championships carousel

Power BI DataViz World Championships - June 2026

A new Power BI DataViz World Championship is coming this June! Don't miss out on submitting your entry.

Top Solution Authors