FabCon is coming to Atlanta
Join us at FabCon Atlanta from March 16 - 20, 2026, for the ultimate Fabric, Power BI, AI and SQL community-led event. Save $200 with code FABCOMM.
Register now!- Power BI forums
- Get Help with Power BI
- Desktop
- Service
- Report Server
- Power Query
- Mobile Apps
- Developer
- DAX Commands and Tips
- Custom Visuals Development Discussion
- Health and Life Sciences
- Power BI Spanish forums
- Translated Spanish Desktop
- Training and Consulting
- Instructor Led Training
- Dashboard in a Day for Women, by Women
- Galleries
- Data Stories Gallery
- Themes Gallery
- Contests Gallery
- QuickViz Gallery
- Quick Measures Gallery
- Visual Calculations Gallery
- Notebook Gallery
- Translytical Task Flow Gallery
- TMDL Gallery
- R Script Showcase
- Webinars and Video Gallery
- Ideas
- Custom Visuals Ideas (read-only)
- Issues
- Issues
- Events
- Upcoming Events
The Power BI Data Visualization World Championships is back! Get ahead of the game and start preparing now! Learn more
- Power BI forums
- Forums
- Get Help with Power BI
- Desktop
- Re: S-Curve Daily Progress
- Subscribe to RSS Feed
- Mark Topic as New
- Mark Topic as Read
- Float this Topic for Current User
- Bookmark
- Subscribe
- Printer Friendly Page
- Mark as New
- Bookmark
- Subscribe
- Mute
- Subscribe to RSS Feed
- Permalink
- Report Inappropriate Content
S-Curve Daily Progress
Hi Good day,
Almost a month Im searching for the answer on my issue, but can't find it. Can anyonr pls help me on this. I have a table. Date, Daily Proress and Sheet 2. Im trying to create S-Curve Plan vs Daily Progress
Thank you in advance,
Allan
Solved! Go to Solution.
- Mark as New
- Bookmark
- Subscribe
- Mute
- Subscribe to RSS Feed
- Permalink
- Report Inappropriate Content
Hi @AllanBerces ,
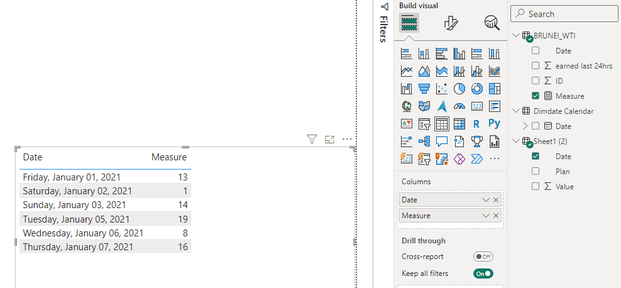
Are the dates you show in Visual in Sheet1(2), I reproduced your scenario
Here are the steps you can follow:
1. Create measure.
Measure =
SUMX(
    FILTER(ALL('BRUNEI_WTI'),
    'BRUNEI_WTI'[Date]=MAX('Sheet1 (2)'[Date])),[earned last 24hrs])
2. Result:
If it doesn't meet your desired outcome, can you share sample data and sample output in table format? Or a sample pbix after removing sensitive data. We can better understand the problem and help you.
Best Regards,
Liu Yang
If this post helps, then please consider Accept it as the solution to help the other members find it more quickly
- Mark as New
- Bookmark
- Subscribe
- Mute
- Subscribe to RSS Feed
- Permalink
- Report Inappropriate Content
Hi,
by the way i have separate column for category.
- Mark as New
- Bookmark
- Subscribe
- Mute
- Subscribe to RSS Feed
- Permalink
- Report Inappropriate Content
Hi,
Thank on your reply, the result on the measure sum of all. How can i filter it on specific category? coz the earned last 24 hrs has diffrent category.
Thank you
- Mark as New
- Bookmark
- Subscribe
- Mute
- Subscribe to RSS Feed
- Permalink
- Report Inappropriate Content
Thank you very much save me a lot
- Mark as New
- Bookmark
- Subscribe
- Mute
- Subscribe to RSS Feed
- Permalink
- Report Inappropriate Content
@AllanBerces , You can compare it with the previous day's value and make it balnk. Hope you are using a date table joined with date of your table and used in the slicer, visual, and measures
Try measures like
M1 = Sum(Table[Earned 24 Hours])
M1 Last = calculate([M1], previousday(Date[Date])
M1 Used = if([M1] = [M1 Last] , blank(), [M1])
Why Time Intelligence Fails - Powerbi 5 Savior Steps for TI :https://youtu.be/OBf0rjpp5Hw
https://amitchandak.medium.com/power-bi-5-key-points-to-make-time-intelligence-successful-bd52912a5b...
To get the best of the time intelligence function. Make sure you have a date calendar and it has been marked as the date in model view. Also, join it with the date column of your fact/s. Refer :radacad sqlbi My Video Series Appreciate your Kudos.
- Mark as New
- Bookmark
- Subscribe
- Mute
- Subscribe to RSS Feed
- Permalink
- Report Inappropriate Content
Thank you amitchandak but the result still the same.
Helpful resources

Power BI Dataviz World Championships
The Power BI Data Visualization World Championships is back! Get ahead of the game and start preparing now!

| User | Count |
|---|---|
| 38 | |
| 38 | |
| 37 | |
| 28 | |
| 28 |
| User | Count |
|---|---|
| 124 | |
| 89 | |
| 73 | |
| 66 | |
| 65 |


