Join us at FabCon Vienna from September 15-18, 2025
The ultimate Fabric, Power BI, SQL, and AI community-led learning event. Save €200 with code FABCOMM.
Get registered- Power BI forums
- Get Help with Power BI
- Desktop
- Service
- Report Server
- Power Query
- Mobile Apps
- Developer
- DAX Commands and Tips
- Custom Visuals Development Discussion
- Health and Life Sciences
- Power BI Spanish forums
- Translated Spanish Desktop
- Training and Consulting
- Instructor Led Training
- Dashboard in a Day for Women, by Women
- Galleries
- Data Stories Gallery
- Themes Gallery
- Contests Gallery
- Quick Measures Gallery
- Notebook Gallery
- Translytical Task Flow Gallery
- TMDL Gallery
- R Script Showcase
- Webinars and Video Gallery
- Ideas
- Custom Visuals Ideas (read-only)
- Issues
- Issues
- Events
- Upcoming Events
Enhance your career with this limited time 50% discount on Fabric and Power BI exams. Ends August 31st. Request your voucher.
- Power BI forums
- Forums
- Get Help with Power BI
- Desktop
- Re: Rolling Sum of a quantity plus another value
- Subscribe to RSS Feed
- Mark Topic as New
- Mark Topic as Read
- Float this Topic for Current User
- Bookmark
- Subscribe
- Printer Friendly Page
- Mark as New
- Bookmark
- Subscribe
- Mute
- Subscribe to RSS Feed
- Permalink
- Report Inappropriate Content
Rolling Sum of a quantity plus another value
Ok hopefully I explain this well. I have a matrix table setup with 3 columns so far. I have it broken down by Item ID and Month/Year.
For each month we have adds and uses on the Item ID. Basically the Adds are incoming stock from Purchase Orders and the Uses are what will go out via our Work Orders/Sales Orders. I then subtract the Adds from the Uses to get the Net column.
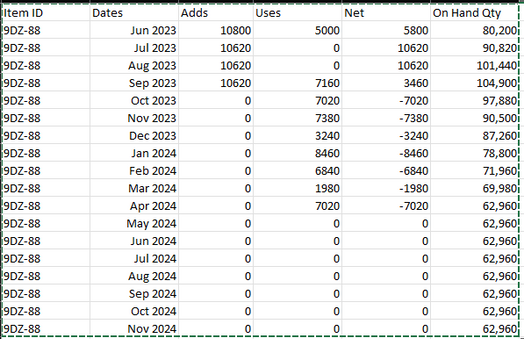
What I need to do then is take the current Item On Hand Qty and do a rolling Sum of each Net row. So lets say for Item 9DZ-88 I have a current On Hand Qty of 76,980 then Add it to the May 2023 Net which is 3,220 and arrive at 80,200 then Jun 2023 Net which is 5,800 and arrive at 86,000. See Example set below.
Item ID 9DZ-88 has a starting On Hand Qty of 76,980:
Any help is greatly appreciated and just trying to see the best way to arrive at the current On Hand Qty after each month.
Thank you.
Solved! Go to Solution.
- Mark as New
- Bookmark
- Subscribe
- Mute
- Subscribe to RSS Feed
- Permalink
- Report Inappropriate Content
I looked at various articles before and after posting my question and believe I was able to figure it out.
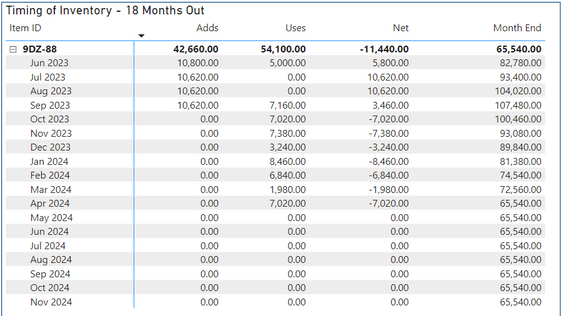
I created a measure to solve this. These values all come from different tables which are all related by the Item ID. I also created a DateTable to help with the relationships between all the table dates.
The numbers all seem to add up correct for the few that I checked so far.
- Mark as New
- Bookmark
- Subscribe
- Mute
- Subscribe to RSS Feed
- Permalink
- Report Inappropriate Content
@MP-iCONN This has a recursive element to it so generally it would not be possible to do what you want. However, in this case there may be a way around it. So, what you could do is create a measure (or possibly a column) where would would grabe all previous rows for that item and add up the Net for those rows and tack that onto your original starting quantity. Not super efficient but better than not possible. If you can share sample data as text can probably mock it up.
Follow on LinkedIn
@ me in replies or I'll lose your thread!!!
Instead of a Kudo, please vote for this idea
Become an expert!: Enterprise DNA
External Tools: MSHGQM
YouTube Channel!: Microsoft Hates Greg
Latest book!: DAX For Humans
DAX is easy, CALCULATE makes DAX hard...
- Mark as New
- Bookmark
- Subscribe
- Mute
- Subscribe to RSS Feed
- Permalink
- Report Inappropriate Content
I looked at various articles before and after posting my question and believe I was able to figure it out.
I created a measure to solve this. These values all come from different tables which are all related by the Item ID. I also created a DateTable to help with the relationships between all the table dates.
The numbers all seem to add up correct for the few that I checked so far.
- Mark as New
- Bookmark
- Subscribe
- Mute
- Subscribe to RSS Feed
- Permalink
- Report Inappropriate Content
Helpful resources
| User | Count |
|---|---|
| 78 | |
| 74 | |
| 43 | |
| 32 | |
| 28 |
| User | Count |
|---|---|
| 104 | |
| 93 | |
| 51 | |
| 51 | |
| 46 |


