Join us in Barcelona for FabCon and SQLCon, September 28 - October 1, 2026.
This is best Fabric, Power BI, SQL and AI community event. How do we know? The last event sold out! Save €200 with code FABCMTY200.
Register now- Power BI forums
- Get Help with Power BI
- Desktop
- Service
- Report Server
- Power Query
- Mobile Apps
- Developer
- DAX Commands and Tips
- Custom Visuals Development Discussion
- Health and Life Sciences
- Power BI Spanish forums
- Translated Spanish Desktop
- Training and Consulting
- Instructor Led Training
- Dashboard in a Day for Women, by Women
- Galleries
- Data Stories Gallery
- Themes Gallery
- Contests Gallery
- QuickViz Gallery
- Quick Measures Gallery
- Visual Calculations Gallery
- Fabric Apps Gallery
- Notebook Gallery
- Translytical Task Flow Gallery
- TMDL Gallery
- R Script Showcase
- Webinars and Video Gallery
- Ideas
- Custom Visuals Ideas (read-only)
- Issues
- Issues
- Events
- Upcoming Events
The Fabric community is upgrading! Read all of the details including the timeline and what you can expect. Learn more
- Power BI forums
- Forums
- Get Help with Power BI
- Desktop
- Re: Return Graph
- Subscribe to RSS Feed
- Mark Topic as New
- Mark Topic as Read
- Float this Topic for Current User
- Bookmark
- Subscribe
- Printer Friendly Page

- Mark as New
- Bookmark
- Subscribe
- Mute
- Subscribe to RSS Feed
- Permalink
- Report Inappropriate Content
Return Graph
Good morning,
I have a question, In my table I get a column with years in it (a year can occures plenty of times) and 10 measures which are associated to this column, (M1,....M10).
I would like to have a graph with my 10 measure in my x axis and the value of my measure by year as my values. I join a draw to show you what I expect.

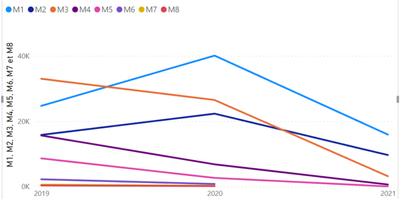
But when I try to do it it gives me this and I don't achieve to modify it:
Solved! Go to Solution.


- Mark as New
- Bookmark
- Subscribe
- Mute
- Subscribe to RSS Feed
- Permalink
- Report Inappropriate Content
Hi @Anonymous ,
If you are using measures on your values you are not abble to get the result you need simply with the use of this measures and the year column.
Create a new table with all your measure names and and ID column something similar to:
| ID | MeasureName |
| 1 | Measure1 |
| 2 | Measure2 |
| ... | ... |
| 10 | Measure10 |
Now create the following measure:
Selection =
SWITCH (
    SELECTEDVALUE ( Table[MeasureName] ),
    1, [Measure1],
    2, [Measure2],
    ..., ...
    10, [Measure10]
)
Now make your line chart with the following setup:
- Axis: MeasureName (Column)
- Legend: Year (Column)
- Values: Selection (Measure)
Should return expected values
Regards
Miguel Félix
Did I answer your question? Mark my post as a solution!
Proud to be a Super User!
Check out my blog: Power BI em Português
- Mark as New
- Bookmark
- Subscribe
- Mute
- Subscribe to RSS Feed
- Permalink
- Report Inappropriate Content
Hi @Anonymous ,
If you are using measures on your values you are not abble to get the result you need simply with the use of this measures and the year column.
Create a new table with all your measure names and and ID column something similar to:
| ID | MeasureName |
| 1 | Measure1 |
| 2 | Measure2 |
| ... | ... |
| 10 | Measure10 |
Now create the following measure:
Selection =
SWITCH (
    SELECTEDVALUE ( Table[MeasureName] ),
    1, [Measure1],
    2, [Measure2],
    ..., ...
    10, [Measure10]
)
Now make your line chart with the following setup:
- Axis: MeasureName (Column)
- Legend: Year (Column)
- Values: Selection (Measure)
Should return expected values
Regards
Miguel Félix
Did I answer your question? Mark my post as a solution!
Proud to be a Super User!
Check out my blog: Power BI em Português- Mark as New
- Bookmark
- Subscribe
- Mute
- Subscribe to RSS Feed
- Permalink
- Report Inappropriate Content
@MFelix Thank you, I tried it but I can't put Year in the legend because is not in the same table so they ask me to manage the relashionship between the two tables. And I can't do it because it's doesn't exist any.
Have you have some idea?
Thank you
- Mark as New
- Bookmark
- Subscribe
- Mute
- Subscribe to RSS Feed
- Permalink
- Report Inappropriate Content
Can you share a sample of your data model, and how the measures are calculated?
Regards
Miguel Félix
Did I answer your question? Mark my post as a solution!
Proud to be a Super User!
Check out my blog: Power BI em Português- Mark as New
- Bookmark
- Subscribe
- Mute
- Subscribe to RSS Feed
- Permalink
- Report Inappropriate Content
- Mark as New
- Bookmark
- Subscribe
- Mute
- Subscribe to RSS Feed
- Permalink
- Report Inappropriate Content
Hi @Anonymous ,
Has you can see I was abble to get results has expected:
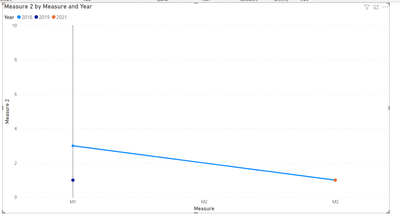
Check PBIX file attach.
Regards
Miguel Félix
Did I answer your question? Mark my post as a solution!
Proud to be a Super User!
Check out my blog: Power BI em Português- Mark as New
- Bookmark
- Subscribe
- Mute
- Subscribe to RSS Feed
- Permalink
- Report Inappropriate Content
Thank you!
Helpful resources

FabCon & SQLCon – Barcelona 2026
Join us in Barcelona for FabCon and SQLCon, the Fabric, Power BI, SQL, and AI community event. Save €200 with code FABCMTY200.

Power BI DataViz World Championships - June 2026
A new Power BI DataViz World Championship is coming this June! Don't miss out on submitting your entry.

| User | Count |
|---|---|
| 24 | |
| 22 | |
| 20 | |
| 18 | |
| 14 |


| User | Count |
|---|---|
| 27 | |
| 21 | |
| 20 | |
| 20 | |
| 20 |


