Get certified for free when you join Fabric Data Days 2026 and dive into Fabric, Power BI, SQL, AI, and other essential data skills.
Join nowJuly 28 - August 9 | Final Round of the Power BI Dataviz World Championships. This is your chance. Learn more
Hello everyone. Got a bit of an interesting issue.
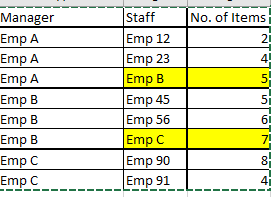
I have a table that has a manager name in one column, and staff reporting to that manager in the second column. I am after a way to display this in Matrix visual so that once the manager is expanded, it shows the staff reporting to the manager. Problem is, there are examples where the staff are themselves manager of other staff.
For example, consider the following table:
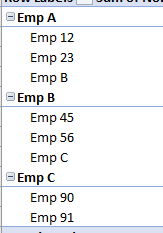
It is giving me a result in this manner:
Ideally, I would like Emp A to be further expanded to Emp B and then in the same row, Emp B to be expanded to their relevant staff. so that when I collapse it, Emp A should also show the sum of items for Emp B staff.
Solved! Go to Solution.
Hi,
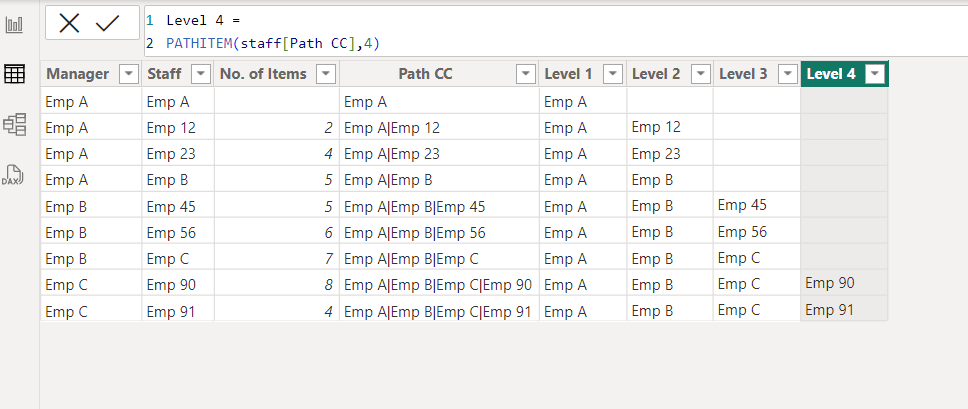
I am not sure how your semantic model looks like, but you can try to use below DAX functions as a starting point of your solution.
Please check the below picture and the attached pbix file.
PATH function (DAX) - DAX | Microsoft Learn
PATHITEM function (DAX) - DAX | Microsoft Learn
Hi,
I am not sure how your semantic model looks like, but you can try to use below DAX functions as a starting point of your solution.
Please check the below picture and the attached pbix file.
PATH function (DAX) - DAX | Microsoft Learn
PATHITEM function (DAX) - DAX | Microsoft Learn
Hi @Jihwan_Kim Thank you so much mate. I never knew about the path function. This has done the trick for me cheers for that.
If you love stickers, then you will definitely want to check out our community sticker challenge, Barcelona edition!
Check out the July 2026 Power BI update to learn about new features.
| User | Count |
|---|---|
| 29 | |
| 28 | |
| 20 | |
| 20 | |
| 19 |
| User | Count |
|---|---|
| 35 | |
| 28 | |
| 21 | |
| 19 | |
| 17 |