cancel
Showing results for 
Search instead for 
Did you mean: 

July 7 - July 17 | Round 2 of the Power BI Dataviz World Championships. Don't miss your chance! Learn more

Reply
Medmanage101
Frequent Visitor

Refresh But Compare

I have a simple Excel sheet that gets updated and changed weekly.  Hitting 'Refresh' works great but now last week's data is gone.  Any ideas on how I have a visual that shows the comparisons of each week?  There is not a date column in my data source.   It is simple data...a list of employees.  This changes every week and I need to see those changes.  (30 down to 27 this week.)  But my 30 does not exist once the list is updated.  It only shows a current list of employees at 27.  Could Power Bi add a date column every time I hit refresh?  Ideas? Help.

2 REPLIES 2
Medmanage101
Frequent Visitor

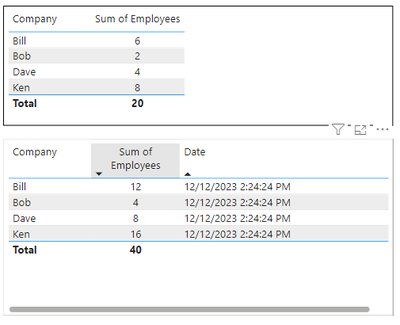
When I 'Append' I just got double the numbers (employees).  Not two sets with different dates and times.  I went from 20 employees to 40, all with the same date and time every time I refresh.

Medmanage101_0-1702412820237.png


Awm
Advocate I
Advocate I

Certainly! Here's a detailed step-by-step explanation:


1. Duplicate Data:
- In Power BI, go to the Power Query Editor by selecting "Transform Data."
- In the Query Editor, find your data query, right-click on it, and choose "Duplicate." This creates a copy of your existing data query.

2.Add Date Column:
- In the duplicated query, click on "Add Column" in the ribbon, then select "Date & Time" and choose "Date." This adds a new column with the current date for each row.
- If you want an automated date, you can use the formula `DateTime.LocalNow()` in the new column.

3. Combine Data:
- Still in the Query Editor, select the original and duplicated queries.
- Go to the "Home" tab, click on "Combine Queries," and choose "Append Queries." This combines both queries into one.

4. Load Data:
- After combining the queries, click on "Close & Apply" to load the data back into Power BI.

5. Visualize Changes:
- In your report view, create visualizations using the combined data.
- Include the newly added date column in your visuals to track changes over time.

6. Refresh:
- Each time you hit the refresh button in Power BI, the duplicated query captures the current data with a new date, preserving historical snapshots.

By following these steps, you'll have a setup that maintains a historical record of your data, allowing you to analyze and visualize changes over different weeks.

Helpful resources

Announcements
FabCon and SQLCon Barcelona 2026

FabCon & SQLCon – Barcelona 2026

Join us in Barcelona for FabCon and SQLCon, the Fabric, Power BI, SQL, and AI community event. Save €200 with code FABCMTY200.

60 days of Data Days Carousel

Data Days 2026

Join Fabric Data Days 2026: 60 days of free live/on-demand sessions, challenges, study groups, and certification opportunities.

Power BI DataViz World Championships carousel

Power BI DataViz World Championships - June 2026

A new Power BI DataViz World Championship is coming this June! Don't miss out on submitting your entry.

Top Solution Authors