Hi @Anonymous,
Please download the demo in the attachment.
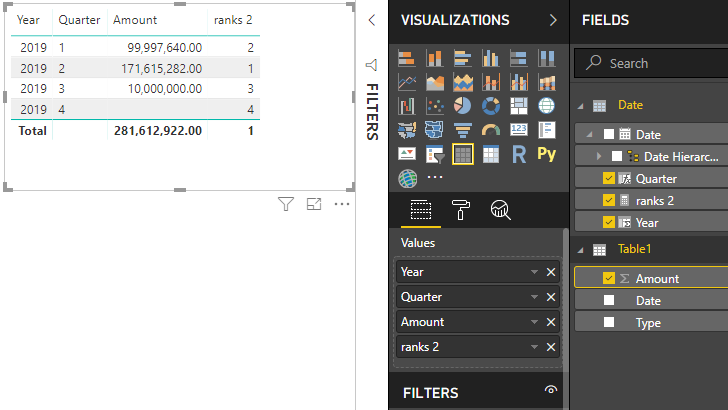
1. Create columns for [Year] and [Quarter] in the date table.
2. Create a measure.
ranks 2 =
RANKX (
    ALL ( 'Date'[Year], 'Date'[Quarter] ),
    CALCULATE ( SUM ( Table1[Amount] ) ),
    ,
    ,
    SKIP
)
Best Regards,
Dale
Community Support Team _ Dale
If this post helps, then please consider Accept it as the solution to help the other members find it more quickly.

.PNG")

