Get certified for free when you join Fabric Data Days 2026 and dive into Fabric, Power BI, SQL, AI, and other essential data skills.
Join nowJuly 7 - July 17 | Round 2 of the Power BI Dataviz World Championships. Don't miss your chance! Learn more
Hi All,
I'm facing with rank problem.
I want to give rank to below values. If it is equals it doesn't matter select one of them or sort by Category
I tried this dax but it gives same rank if the values are equal
Measure = RANKX(ALLSELECTED(Table1),CALCULATE(SUM(Table1[Values]),ALLEXCEPT(Table1,Table1[Cat])),,DESC,Dense)
I copied it from anouther post...
https://community.powerbi.com/t5/Desktop/Ranking-a-measure/td-p/539066
I want this output on measure not column...
Category Values
| A | 50 |
| B | 20 |
| C | 30 |
| D | 50 |
| E | 20 |
| F | 80 |
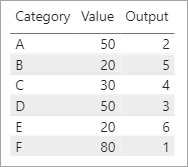
Expected Output
CategoryValuesOutput
| A | 50 | 2 |
| B | 20 | 5 |
| C | 30 | 4 |
| D | 50 | 3 |
| E | 20 | 6 |
| F | 80 | 1 |
Thanks All,
Solved! Go to Solution.
@Anonymous
I was able to replicate your desired output with this.
Output =
VAR _Category = SELECTEDVALUE ( 'DataTable'[Category] )
VAR _Value = SELECTEDVALUE ( 'DataTable'[Value] )
VAR _Rank =
COUNTROWS ( FILTER ( ALL ( 'DataTable' ), 'DataTable'[Value] > _Value ) ) + 1
VAR _TieBreak =
COUNTROWS (
FILTER (
ALL ( 'DataTable' ),
'DataTable'[Category] < _Category
&& 'DataTable'[Value] = _Value
)
)
RETURN
_Rank + _TieBreak
@Anonymous
I was able to replicate your desired output with this.
Output =
VAR _Category = SELECTEDVALUE ( 'DataTable'[Category] )
VAR _Value = SELECTEDVALUE ( 'DataTable'[Value] )
VAR _Rank =
COUNTROWS ( FILTER ( ALL ( 'DataTable' ), 'DataTable'[Value] > _Value ) ) + 1
VAR _TieBreak =
COUNTROWS (
FILTER (
ALL ( 'DataTable' ),
'DataTable'[Category] < _Category
&& 'DataTable'[Value] = _Value
)
)
RETURN
_Rank + _TieBreak
Join us in Barcelona for FabCon and SQLCon, the Fabric, Power BI, SQL, and AI community event. Save €200 with code FABCMTY200.
If you love stickers, then you will definitely want to check out our community sticker challenge, Barcelona edition!
Check out the July 2026 Power BI update to learn about new features.
| User | Count |
|---|---|
| 30 | |
| 23 | |
| 23 | |
| 23 | |
| 14 |
| User | Count |
|---|---|
| 46 | |
| 33 | |
| 20 | |
| 18 | |
| 16 |