This is best Fabric, Power BI, SQL and AI community event. How do we know? The last event sold out! Save €200 with code FABCMTY200.
Register nowA new Data Days event is coming soon! This time we’re going bigger than ever. Fabric, Power BI, SQL, AI and more. Don't miss out.
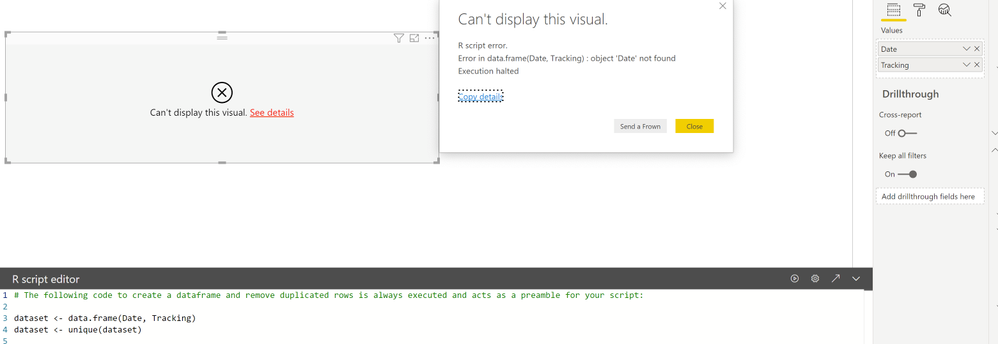
I am using the R script editor in Power BI. I selected the fields need for my visualization in the values section in the Visualization pane. When I ran the code to just sent test, I . got a message stating, "Can't display this visual. R Script error. Error in data.frame(Date, Tracking): object 'Date not found Execution halted.
Afterwards, I pasted the full code for my visualization and I got the same answer. I already tested the code in RStudio and it worked fine on that program.
I'm unsure why Power BI is not detecting the columns in the data frame, because clearly the fields I selected are in the data frame generated by Power BI. How do I resolve this issue?
Hi @Anonymous ,
Please update the R version to supported version R 3.3.1, R 3.3.0, MRO 3.3.1, MRO 3.3.0, MRO 3.2.2 then test again.
If issue persists, please enable desktop trace log, repeat steps until error occurs, share trace log files with us.
Hi,
I have R-3.6.1 so I will un-install and download the versions you mentioned. Thanks for your quick response.
Best
Check out the May 2026 Power BI update to learn about new features.
Sign up to receive a private message when registration opens and key events begin.
If you have recently started exploring Fabric, we'd love to hear how it's going. Your feedback can help with product improvements.
| User | Count |
|---|---|
| 27 | |
| 25 | |
| 25 | |
| 21 | |
| 14 |
| User | Count |
|---|---|
| 51 | |
| 46 | |
| 23 | |
| 18 | |
| 18 |