cancel
Showing results for 
Search instead for 
Did you mean: 

The Fabric community is upgrading! Read all of the details including the timeline and what you can expect. Learn more

Reply
Anonymous
Not applicable

Problems graphing values

This site has been most helpful in solving BI issues that I have. Thanks.


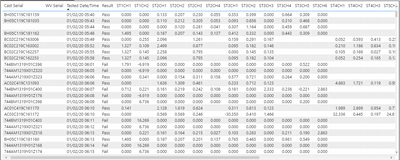
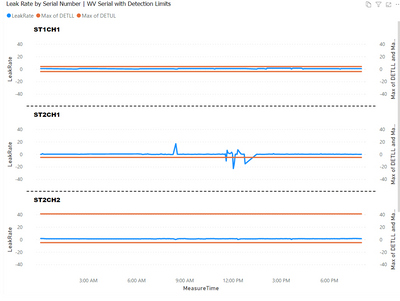
Here is another problem I can't figure out. I am wanting to create individual graphs for each of the STCH pairs shown below (there will be about 24 graphs). The date is on the x axis and the STCH values on the Y. My problem is that for the STCH values, I need the actual value. In the axis setup, my choices are sum, count, median, etc. I know someone who made a chart like I want but he isn't the sharing type. His graph is below as well. I think I can figure out how to graph the DETLL and DETUL but help with that would be appreciated as well.


sb14415_0-1643203807654.png

sb14415_1-1643204011853.png


2 REPLIES 2
Anonymous
Not applicable

sorry I've been out with the crud. I'll try and let everyone know the results

Anonymous
Not applicable

Hey, 

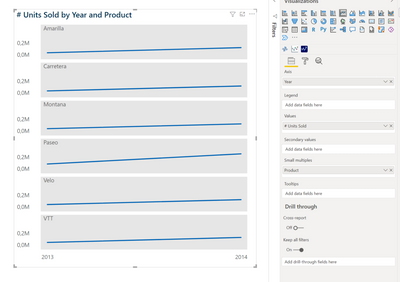
This does look a  bit like small multiples. Perhaps you could try this approach.
You would need 3 Measures (as per example shown) - LeakRate Max of DETLL and Max of DETUL
Then just add all to graph, used test data for this:

MargaritaG_0-1643206780341.png

Then you could play with formatting to achieve best result
Let me know if that solves your issue


Helpful resources

Announcements
FabCon and SQLCon Barcelona 2026

FabCon & SQLCon – Barcelona 2026

Join us in Barcelona for FabCon and SQLCon, the Fabric, Power BI, SQL, and AI community event. Save €200 with code FABCMTY200.

Power BI DataViz World Championships carousel

Power BI DataViz World Championships - June 2026

A new Power BI DataViz World Championship is coming this June! Don't miss out on submitting your entry.