Get certified for free when you join Fabric Data Days 2026 and dive into Fabric, Power BI, SQL, AI, and other essential data skills.
Join nowJuly 7 - July 17 | Round 2 of the Power BI Dataviz World Championships. Don't miss your chance! Learn more
Hello!
I am running into an issue when I run a power query on transposed data.
I recieve reports in rows:
1 2
Site Name: xyz
Cost: $$
Sq. Ft: ##
etc.
When I upload the source file via folder the data comes back to me stacked. Therefore when I transpose the data in order to make column 1 my row headers all of my information is listed in the same row. I would like to create a new row under the same column header for each report. Is this possible?
Hi @Tylerspears27,
I recieve reports in rows:
1 2
Site Name: xyz
Cost: $$
Sq. Ft: ##
etc.
When I upload the source file via folder the data comes back to me stacked. Therefore when I transpose the data in order to make column 1 my row headers all of my information is listed in the same row. I would like to create a new row under the same column header for each report. Is this possible?
If I understand your scenario correctly that you have several tables with the similar values and you want to get the output below.
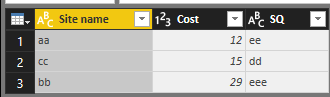
You could follow the steps to get the output above.
1. Go to Query Editor, and transpose your columns to get Site name , cost and SQ as Columns. Do this operator for each table.
2. Click Use First Row as Headers
3. Click Append.
In addition, you could refer to my pbix file.
Best Regards,
Cherry
Thank you for your response.
I am curious if there is a way to automate this process. I do not want to upload each file individually then append them together each time a new report is generated. Currently I have it pulling from a folder source and therefore not able to append the tables together from the same sheet. Is there any way around this problem?
Join us in Barcelona for FabCon and SQLCon, the Fabric, Power BI, SQL, and AI community event. Save €200 with code FABCMTY200.
Join Data Days 2026: 60 days of free live/on-demand sessions, challenges, study groups, and certification opportunities.
| User | Count |
|---|---|
| 28 | |
| 27 | |
| 25 | |
| 23 | |
| 17 |
| User | Count |
|---|---|
| 53 | |
| 46 | |
| 38 | |
| 30 | |
| 21 |