This is best Fabric, Power BI, SQL and AI community event. How do we know? The last event sold out! Save €200 with code FABCMTY200.
Register nowJuly 28 - August 9 | Final Round of the Power BI Dataviz World Championships. This is your chance. Learn more
Hi All,
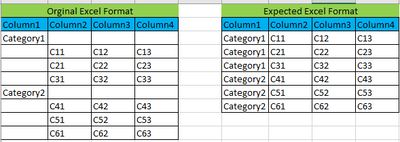
I have a excel and i want to generate the report out it. The data population in the excel is some what different, so i want to convert them in my own format in Power BI. Refer the below example,
Note: Due to some reason, we can't make any changes in excel .
Kinldy let me know if there is any way to do it in Power BI.
Thanks,
Vinoth
Solved! Go to Solution.
In the first column, you can 'replace values' on blank or "" with null (You want to get null in all those cells - apart from the legitimate values)
Then use 'Fill Down' on the first column.
Then Filter out the blank rows from column2 header
In the first column, you can 'replace values' on blank or "" with null (You want to get null in all those cells - apart from the legitimate values)
Then use 'Fill Down' on the first column.
Then Filter out the blank rows from column2 header
Join us in Barcelona for FabCon and SQLCon, the Fabric, Power BI, SQL, and AI community event. Save €200 with code FABCMTY200.
If you love stickers, then you will definitely want to check out our community sticker challenge, Barcelona edition!
Check out the July 2026 Power BI update to learn about new features.
| User | Count |
|---|---|
| 25 | |
| 23 | |
| 19 | |
| 17 | |
| 14 |
| User | Count |
|---|---|
| 24 | |
| 23 | |
| 20 | |
| 20 | |
| 19 |