This is best Fabric, Power BI, SQL and AI community event. How do we know? The last event sold out! Save €200 with code FABCMTY200.
Register nowJuly 28 - August 9 | Final Round of the Power BI Dataviz World Championships. This is your chance. Learn more
Hi everyone,
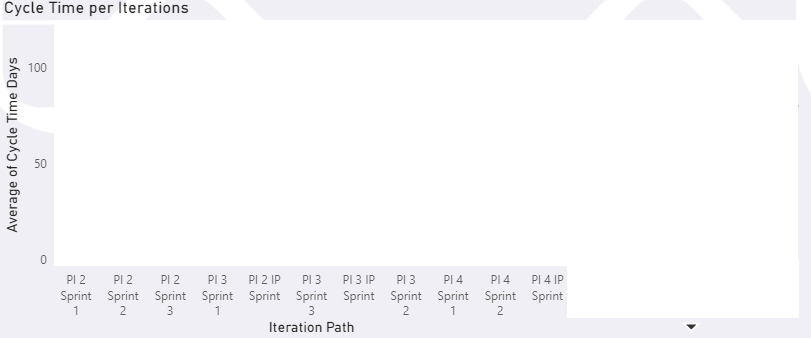
I'm creating a report with filtering, plots and statistics and I am facing one issue. How to sort X axis in the scatter plot ?
I'm creating a Scatter plot from scratch and on X axis I have Iteration paths and my Y axis is Cycle times for items. I have sorted Iteration paths in Column, in the filter and on the plot, but in reality it is not. I'm providing a 2 screenshots, one is filter sorting and the other one is plot in reality.
Thank you in advance
P.S. Sorted on the plot as well. Three dots Sort by ascending or descending.
Hi @SyVe ,
How about the result after you follow the suggestions mentioned in my original post?Could you please provide more details about it If it doesn't meet your requirement?
Best regards,
Hi @SyVe ,
Since the sort order in slicer seems customize, we think you have sort the x-axis by another sort column properly. Could please check if the scatter chart is sort by the x-axis? Or try to reproduce the same issue on the sample file we shared?
By the way, PBIX file as attached.
Best regards,
This is a text column and if and if you do not want change sort column, you need to create a sort column for this column and mark that as sort column for that
https://docs.microsoft.com/en-us/power-bi/desktop-sort-by-column
Sort Asc and Sort desc should sort otherwise.
Join us in Barcelona for FabCon and SQLCon, the Fabric, Power BI, SQL, and AI community event. Save €200 with code FABCMTY200.
If you love stickers, then you will definitely want to check out our community sticker challenge, Barcelona edition!
Check out the July 2026 Power BI update to learn about new features.
| User | Count |
|---|---|
| 25 | |
| 23 | |
| 19 | |
| 17 | |
| 14 |
| User | Count |
|---|---|
| 24 | |
| 20 | |
| 20 | |
| 19 | |
| 19 |