cancel
Showing results for 
Search instead for 
Did you mean: 

July 28 - August 9 | Final Round of the Power BI Dataviz World Championships. This is your chance. Learn more

Reply
Amratya
Advocate I
Advocate I

Plot the difference between two rows in calculated column

I need to know how to get the difference between two rows in DAX


This is my sample data, I need to get difference in net sales between each day in a new column not a mesaure to be able to plot it to a line graph.


ID / Date          / Time        / Net Sales 
1a 17-01-2017 3:21:44 PM  $ 20.00
1a 17-01-2017 3:21:25 PM  $ 0.91
1a 17-01-2017 3:20:37 PM  $ 3.18
1b 17-01-2017 3:20:20 PM  $ 101.82  
1b 17-01-2017 7:47:22 AM  $ 101.82
1c 17-01-2017 7:47:07 AM  $ 23.64
1d 12-01-2017 2:37:01 PM  $ 0.91
1e 07-01-2017 2:17:25 PM  $ 9.91
1f 07-01-2017 2:12:24 PM  $ 0.91
1g 05-01-2017 9:17:03 AM  $ 2.32
1g 05-01-2017 9:16:26 AM  $ 2.32
1h 04-01-2017 9:47:08 PM  $ 12.01
1h 04-01-2017 9:27:26 PM  $ 12.91
1h 04-01-2017 6:52:42 PM  $ 12.91
1e 03-01-2017 7:38:55 PM  $ 7.91
1e 03-01-2017 6:55:20 PM  $ 7.91
1e 03-01-2017 4:09:40 PM  $ 7.91
1e 03-01-2017 1:20:57 PM  $ 7.91
1f 03-01-2017 12:59:19 PM  $ 5.91

1 ACCEPTED SOLUTION
Amratya
Advocate I
Advocate I

I reached to get it as a measure through this 

Change = 
 CALCULATE(
 SUM('TableName'[Net Sales]), 
 FILTER('TableName','TableName'[Date]=MAX('TableName'[Date])
 )
 )- 
 CALCULATE(
 SUM('TableName'[Net Sales]),
 FILTER('TableName','TableName'[Date]=MIN('TableName'[Date])))

But I still can't plot it to a line chart or a waterfall chart (which is the target actually)

View solution in original post

3 REPLIES 3
Amratya
Advocate I
Advocate I

I reached to get it as a measure through this 

Change = 
 CALCULATE(
 SUM('TableName'[Net Sales]), 
 FILTER('TableName','TableName'[Date]=MAX('TableName'[Date])
 )
 )- 
 CALCULATE(
 SUM('TableName'[Net Sales]),
 FILTER('TableName','TableName'[Date]=MIN('TableName'[Date])))

But I still can't plot it to a line chart or a waterfall chart (which is the target actually)

Hi @Amratya,

It returns zero when I use your formula as the screenshot below.

2.PNG

You want to calculate the difference in eact day regardless of Id, for example, it should be 101.82(max)-0.91(min) for 2017/1/17, right? If it is, you can use the following formula to calculate a measure.

Change = 
 CALCULATE(
 MAX('TableName'[Net Sales ]), 
 ALLEXCEPT('TableName',TableName[Date])
 )
 - 
 CALCULATE(
 MIN('TableName'[Net Sales ]),
 ALLEXCEPT('TableName',TableName[Date]))


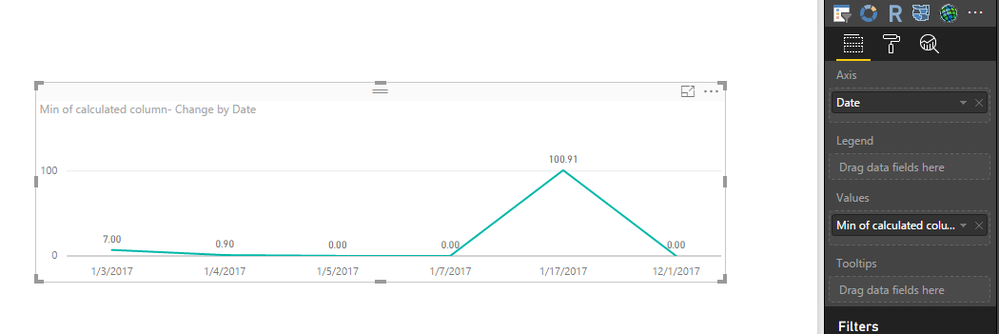
Create a line chart, select a date as row level, the 'change' measure as value level, please see the screenshot.

3.png
In addtion, you want to create a calculated column rath than a measure. So you can create the calculated column using same DAX formula, you will get expected result.

5.PNG

Select the Date column as row level, the calculated column as value level, you also get the desired result.

6.PNG
Please feel free to ask if you have any question.

Best Regards,
Angelia

I think this is not working correctly for me, as you can see in the "calculated column - change" it should display (12-7 = 5) beside the date 4/1 because the difference in netsales between 4/1 and 3/1 is (12-7 = 5) also beside 5/1 is dhould display (2-12 = -10) 


The used formula I used in a mesure is working ideally only when using a slicer and select two dates

Helpful resources

Announcements
Fabric Community Sticker Design Challenge Barcelona Carousel

Fabric Community Sticker Challenge - Barcelona 2026

If you love stickers, then you will definitely want to check out our community sticker challenge, Barcelona edition!

July Power BI Update Carousel

Power BI Monthly Update - July 2026

Check out the July 2026 Power BI update to learn about new features.

Power BI DataViz World Championships carousel

Power BI DataViz World Championships - June 2026

A new Power BI DataViz World Championship is coming this June! Don't miss out on submitting your entry.

Top Solution Authors