- Subscribe to RSS Feed
- Mark Topic as New
- Mark Topic as Read
- Float this Topic for Current User
- Bookmark
- Subscribe
- Printer Friendly Page
- Mark as New
- Bookmark
- Subscribe
- Mute
- Subscribe to RSS Feed
- Permalink
- Report Inappropriate Content

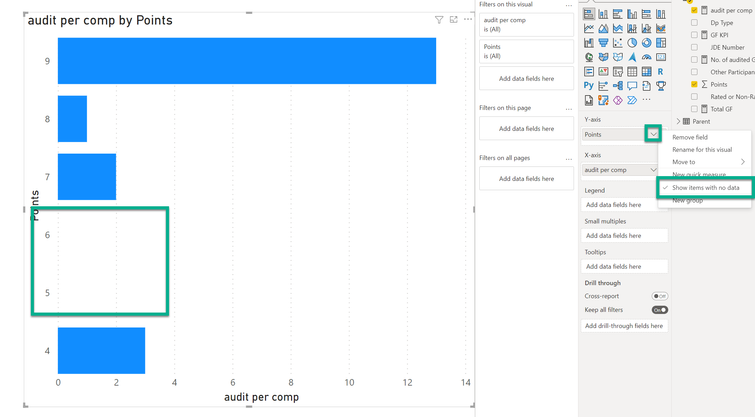
Please tell me how to display even 0 data in the category.
I have some questions, so let me ask you a question.
I created a horizontal bar graph like an image. Please tell me how to display data with a numerical value of 0 in the Y-axis category.
- Mark as New
- Bookmark
- Subscribe
- Mute
- Subscribe to RSS Feed
- Permalink
- Report Inappropriate Content

Hi @Tome_05
I did a local test, when the sales is 0,the category E will display by default.
I have no idea why yours not,maybe you can update you power bi desktop to the latest.
Then if this issue still exist,please provide us some sample data and show us how is your graph looks like ,so that we can reproduce your issue and find a solution.
Best Regards,
Community Support Team _Isabella
If this post helps, then please consider Accept it as the solution to help the other members find it more quickly.
- Mark as New
- Bookmark
- Subscribe
- Mute
- Subscribe to RSS Feed
- Permalink
- Report Inappropriate Content

Thank you for answering.
I implemented the solution immediately, but I could not display it well.
Probably because it is filtered.
What I want to do is filter the data with only the number 1 displayed in the red frame of this image to display the data.
However, when I did this, there was originally content that did not have the number 1 and it seemed that it could not be displayed.
There are 13 contents in total, but 12 have the number 1.
Since there is one data with the number 1 being 0, I want to be able to display that as well in the graph.
- Mark as New
- Bookmark
- Subscribe
- Mute
- Subscribe to RSS Feed
- Permalink
- Report Inappropriate Content

Hi @Tome_05 if you are using Power Query to filter a number (as per the screenshot), you are effectively removing it permanently from your model. If you want it back, go to the Applied Steps pane on the right side of the screenshot and click through to find out where you filtered the data. Once you find that step, delete it, and the filtered data will come back to being unfiltered. Only delete that single step and then click back to the last step to get back to where you where.
Hope this helps.
Theo
If I have posted a response that resolves your question, please accept it as a solution to formally close the post.
Also, if you are as passionate about Power BI, DAX and data as I am, please feel free to reach out if you have any questions, queries, or if you simply want to connect and talk to another data geek!
Want to connect?www.linkedin.com/in/theoconias
- Mark as New
- Bookmark
- Subscribe
- Mute
- Subscribe to RSS Feed
- Permalink
- Report Inappropriate Content

@Tome_05 if the solution that @tom480 put up is not what you were referring to, you can try to click on the Y-axis down arrow and select the "Show items with no data".
If I have posted a response that resolves your question, please accept it as a solution to formally close the post.
Also, if you are as passionate about Power BI, DAX and data as I am, please feel free to reach out if you have any questions, queries, or if you simply want to connect and talk to another data geek!
Want to connect?www.linkedin.com/in/theoconias
- Mark as New
- Bookmark
- Subscribe
- Mute
- Subscribe to RSS Feed
- Permalink
- Report Inappropriate Content

Hi @Tome_05 ,
Is this what you are looking for? If so, please mark as a solution to help others find the answer please. Enjoy! Tom 😀
Helpful resources
| Subject | Author | Posted | |
|---|---|---|---|
| 05-23-2024 05:43 AM | |||
| 03-22-2024 11:36 PM | |||
| 11-08-2023 03:40 AM | |||
| 02-20-2024 06:18 AM | |||
|
Anonymous
| 08-04-2022 03:35 AM |
| User | Count |
|---|---|
| 128 | |
| 100 | |
| 85 | |
| 53 | |
| 46 |


