FabCon is coming to Atlanta
Join us at FabCon Atlanta from March 16 - 20, 2026, for the ultimate Fabric, Power BI, AI and SQL community-led event. Save $200 with code FABCOMM.
Register now!- Power BI forums
- Get Help with Power BI
- Desktop
- Service
- Report Server
- Power Query
- Mobile Apps
- Developer
- DAX Commands and Tips
- Custom Visuals Development Discussion
- Health and Life Sciences
- Power BI Spanish forums
- Translated Spanish Desktop
- Training and Consulting
- Instructor Led Training
- Dashboard in a Day for Women, by Women
- Galleries
- Data Stories Gallery
- Themes Gallery
- Contests Gallery
- Quick Measures Gallery
- Visual Calculations Gallery
- Notebook Gallery
- Translytical Task Flow Gallery
- TMDL Gallery
- R Script Showcase
- Webinars and Video Gallery
- Ideas
- Custom Visuals Ideas (read-only)
- Issues
- Issues
- Events
- Upcoming Events
Calling all Data Engineers! Fabric Data Engineer (Exam DP-700) live sessions are back! Starting October 16th. Sign up.
- Power BI forums
- Forums
- Get Help with Power BI
- DAX Commands and Tips
- Only displaying 0 when between other Data
- Subscribe to RSS Feed
- Mark Topic as New
- Mark Topic as Read
- Float this Topic for Current User
- Bookmark
- Subscribe
- Printer Friendly Page
- Mark as New
- Bookmark
- Subscribe
- Mute
- Subscribe to RSS Feed
- Permalink
- Report Inappropriate Content
Only displaying 0 when between other Data
Goodday,
I have a problem and hope you guys can help. I have the following graph, where i replaced blank values with 0:
My goal is to make it like this
This Graph Follows a slicer that is on the page.
To make the graph more concise i am trying to keep the values before and after any data Blank, and between data i want it to display 0. As if this graph would start at 2021-12 and end at 2022-7, but dynamicly based on the slicer.
Based on the following link i made a measure to count it;

I have been fiddeling with the NOTS, <> and all other things to get it to work, but i am just not able. Do you guys have any idea how to solve this?
Solved! Go to Solution.
- Mark as New
- Bookmark
- Subscribe
- Mute
- Subscribe to RSS Feed
- Permalink
- Report Inappropriate Content
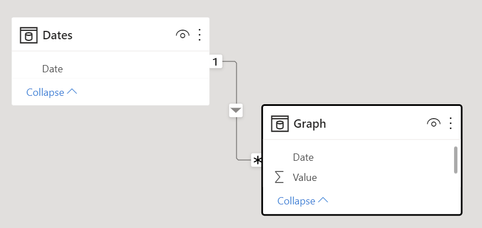
Dates is a dim that stores all dates from the 2000 year.
Graph Value =
var CurrentDate = SELECTEDVALUE( Dates[Date] )
var MinDateWithNonZeroData =
    CALCULATE(
        MINX(
            FILTER(
                Graph,
                Graph[Value] > 0
            ),
            Graph[Date]
        ),
        ALLSELECTED( Dates )
    )
var MaxDateWithNonZeroData =
    CALCULATE(
        MAXX(
            FILTER(
                Graph,
                Graph[Value] > 0
            ),
            Graph[Date]
        ),
        ALLSELECTED( Dates )
    )
var GraphValue =
    if( MinDateWithNonZeroData <= CurrentDate
            && CurrentDate <= MaxDateWithNonZeroData
            && not ISBLANK( MinDateWithNonZeroData ),
        CALCULATE(
            SUM( Graph[Value] ) + 0,
            TREATAS(
                { CurrentDate },
                Graph[Date]
            )
        )
    )
return
GraphValue- Mark as New
- Bookmark
- Subscribe
- Mute
- Subscribe to RSS Feed
- Permalink
- Report Inappropriate Content
Thank you very much! It works great! I even got it working with just Year-Month Values
- Mark as New
- Bookmark
- Subscribe
- Mute
- Subscribe to RSS Feed
- Permalink
- Report Inappropriate Content
Dates is a dim that stores all dates from the 2000 year.
Graph Value =
var CurrentDate = SELECTEDVALUE( Dates[Date] )
var MinDateWithNonZeroData =
    CALCULATE(
        MINX(
            FILTER(
                Graph,
                Graph[Value] > 0
            ),
            Graph[Date]
        ),
        ALLSELECTED( Dates )
    )
var MaxDateWithNonZeroData =
    CALCULATE(
        MAXX(
            FILTER(
                Graph,
                Graph[Value] > 0
            ),
            Graph[Date]
        ),
        ALLSELECTED( Dates )
    )
var GraphValue =
    if( MinDateWithNonZeroData <= CurrentDate
            && CurrentDate <= MaxDateWithNonZeroData
            && not ISBLANK( MinDateWithNonZeroData ),
        CALCULATE(
            SUM( Graph[Value] ) + 0,
            TREATAS(
                { CurrentDate },
                Graph[Date]
            )
        )
    )
return
GraphValueHelpful resources

FabCon Global Hackathon
Join the Fabric FabCon Global Hackathon—running virtually through Nov 3. Open to all skill levels. $10,000 in prizes!

Power BI Monthly Update - October 2025
Check out the October 2025 Power BI update to learn about new features.

| User | Count |
|---|---|
| 12 | |
| 11 | |
| 10 | |
| 9 | |
| 8 |


