Get certified for free when you join Fabric Data Days 2026 and dive into Fabric, Power BI, SQL, AI, and other essential data skills.
Join nowJuly 7 - July 17 | Round 2 of the Power BI Dataviz World Championships. Don't miss your chance! Learn more
Hi All,
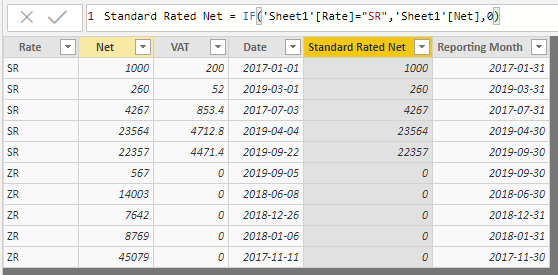
Im trying to calculate a percentage based off two other columns in my Power BI report. I have created a column called the Recovery Percentage to divide the Standard Rated Net by the Net. The Standard Rated Net column has been calculated using the formula:
The Reporting Month has been calculated using the formula:
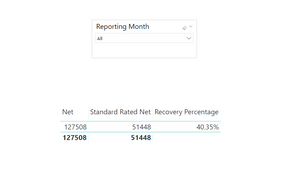
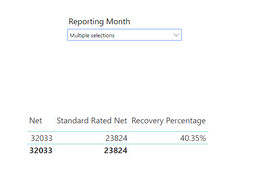
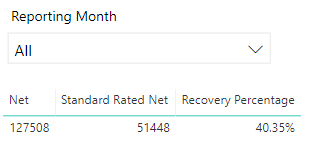
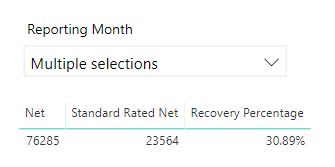
However when I change the Reporting Month filter the percentage doesnt seem to change. Please the attached photos.
This is correct when all months are accounted for.
Once I have selected multiple months the percentage is clearly wrong.
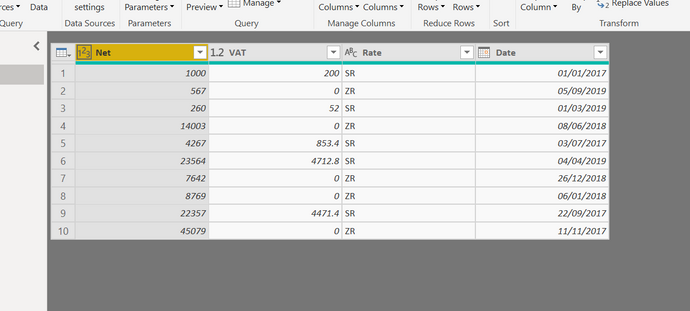
The data inputted is as follows
Any help would be appreciated and thank you in advance!
Solved! Go to Solution.
Hi @I-Jay-I ,
I suggest you to create a measure of Recovery Percentage, then it will work. The following is my sample you can have a try.
The calculated column of Standard Rated Net and Reporting Month are both used your formula.
Standard Rated Net = IF('Sheet1'[Rate]="SR",'Sheet1'[Net],0)
Reporting Month = EOMONTH(Sheet1[Date],0)
Create a measure.
Recovery Percentage = DIVIDE(SUM(Sheet1[Standard Rated Net]),SUM(Sheet1[Net]))
Best Regards,
Xue Ding
If this post helps, then please consider Accept it as the solution to help the other members find it more quickly.
Hi @I-Jay-I ,
I suggest you to create a measure of Recovery Percentage, then it will work. The following is my sample you can have a try.
The calculated column of Standard Rated Net and Reporting Month are both used your formula.
Standard Rated Net = IF('Sheet1'[Rate]="SR",'Sheet1'[Net],0)
Reporting Month = EOMONTH(Sheet1[Date],0)
Create a measure.
Recovery Percentage = DIVIDE(SUM(Sheet1[Standard Rated Net]),SUM(Sheet1[Net]))
Best Regards,
Xue Ding
If this post helps, then please consider Accept it as the solution to help the other members find it more quickly.
Hi Xue Ding,
Thanks for this! It appears I was using new column instead of new measure.
Thanks!
Jay
Join us in Barcelona for FabCon and SQLCon, the Fabric, Power BI, SQL, and AI community event. Save €200 with code FABCMTY200.
Join Data Days 2026: 60 days of free live/on-demand sessions, challenges, study groups, and certification opportunities.
| User | Count |
|---|---|
| 29 | |
| 28 | |
| 27 | |
| 27 | |
| 19 |
| User | Count |
|---|---|
| 56 | |
| 47 | |
| 39 | |
| 28 | |
| 21 |