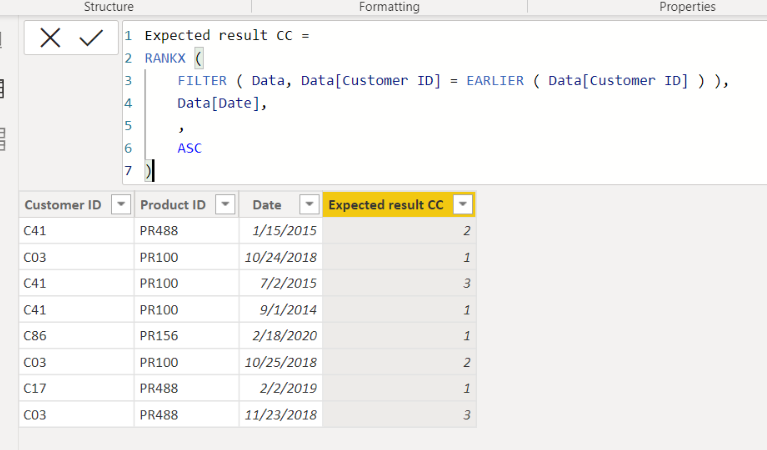
I would do this in the query editor by first doing a Group By step on your Customer column and keeping all rows, then add a rank column to those grouped tables with Table.AddRankColumn, and then re-expand all but the Customer column.
Here is an example. To see how it works, just create a blank query, open the Advanced Editor and replace the text there with the M code below.
let
    Source = Table.FromRows(Json.Document(Binary.Decompress(Binary.FromText("bc67DcAgDIThXaiRfOdAcOosEKVF7L9GeBUgpbri0y87Z3cHOu+eN5jVZRRQFIyu+Io4OhKoq0GIhjZwlhMFaQk3o+BqFobZOSy2pYlWU/wdjPtBpuVV7R2vrZt0CDm78gE=", BinaryEncoding.Base64), Compression.Deflate)), let _t = ((type nullable text) meta [Serialized.Text = true]) in type table [#"Customer ID" = _t, #"Product ID" = _t, Date = _t]),
    #"Changed Type" = Table.TransformColumnTypes(Source,{{"Customer ID", type text}, {"Product ID", type text}, {"Date", type text}}),
    #"Changed Type with Locale" = Table.TransformColumnTypes(#"Changed Type", {{"Date", type date}}, "en-GB"),
    #"Grouped Rows" = Table.Group(#"Changed Type with Locale", {"Customer ID"}, {{"AllRows", each _, type table [Customer ID=nullable text, Product ID=nullable text, Date=nullable date]}}),
    #"Added Custom" = Table.AddColumn(#"Grouped Rows", "Ranked", each Table.AddRankColumn([AllRows], "OrderNumber", {"Date", Order.Ascending})),
    #"Removed Columns" = Table.RemoveColumns(#"Added Custom",{"AllRows"}),
    #"Expanded Ranked" = Table.ExpandTableColumn(#"Removed Columns", "Ranked", {"Product ID", "Date", "OrderNumber"}, {"Product ID", "Date", "OrderNumber"}),
    #"Changed Type1" = Table.TransformColumnTypes(#"Expanded Ranked",{{"Product ID", type text}, {"Date", type date}, {"OrderNumber", Int64.Type}})
in
    #"Changed Type1"
If you really need to do it with a DAX column, you could use this column expression (replace OrderRanks with your actual table name):
OrderNumberDAX =
VAR thisdate = OrderRanks[Date]
RETURN
CALCULATE (
COUNTROWS ( OrderRanks ),
ALLEXCEPT ( OrderRanks, OrderRanks[Customer ID] ),
OrderRanks[Date] <= thisdate
)
Pat
Microsoft Employee