Get certified for free when you join Fabric Data Days 2026 and dive into Fabric, Power BI, SQL, AI, and other essential data skills.
Join nowJuly 7 - July 17 | Round 2 of the Power BI Dataviz World Championships. Don't miss your chance! Learn more
Suppose the data is of the format
TestDate TestName Result
04/19 A 10.6
04/19 B 12.8
04/19 C 12
04/20 D 10
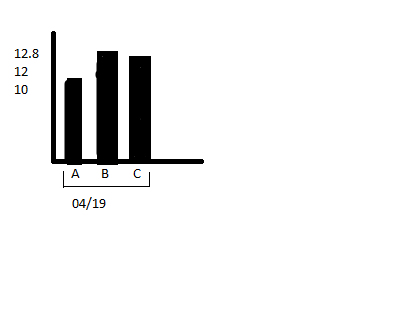
I want to create a chart where the x-axis values will be nested or grouped. Ie, its should have dates and Test names grouped in dates. Y axis should be Result. Below example shows a sample for 04/19 data.
This feature is not available yet.
if you'd like to see it - Vote here
https://ideas.powerbi.com/forums/265200-power-bi-ideas/suggestions/11524623-nested-x-axis-labels
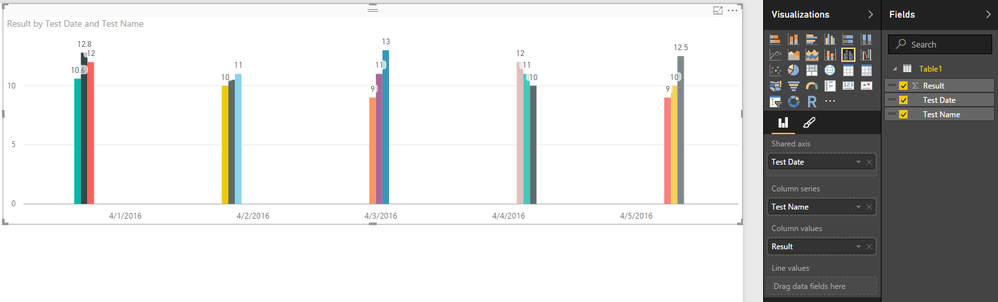
Ok clarification. You actually don't need Nested X-Axis - just do as in image below
This is what Nested X-Axis and the Idea I posted in previous reply was really about...
That didn't help any... I still get only one line, and one value on the X-Axis. It looks like I'll have to stay with Excel spreadsheets since Power BI doesn't even come close to matching the functionality there at this time.
I cannot find a way to get more than one group to appear on the X axis either and this is a vital missing feature making Power BI much less useful as a result.
I tried to vote on the user voice site but it appears to be broken at the moment:
https://ideas.powerbi.com/forums/265200-power-bi-ideas/suggestions/11524623-nested-x-axis-labels
Yes I agree this is a vital function that has been missed and I whichever way I try to do this I cannot get more than one group to appear on the X axis making Power BI rather limited.
Join us in Barcelona for FabCon and SQLCon, the Fabric, Power BI, SQL, and AI community event. Save €200 with code FABCMTY200.
Join Data Days 2026: 60 days of free live/on-demand sessions, challenges, study groups, and certification opportunities.
| User | Count |
|---|---|
| 29 | |
| 27 | |
| 24 | |
| 24 | |
| 18 |
| User | Count |
|---|---|
| 54 | |
| 50 | |
| 41 | |
| 33 | |
| 29 |