This is best Fabric, Power BI, SQL and AI community event. How do we know? The last event sold out! Save €200 with code FABCMTY200.
Register nowThe Fabric community is upgrading! Read all of the details including the timeline and what you can expect. Learn more
Hi
I have a requirement to show Card visual with Current_Year and Prior_Year value one below other
And I need to compare values and change color to Red/Green/Amber
Normally, a card visual shows only one value and no conditional formatting ailable.
How can I achieve my requirement
Please suggest
Regards
Solved! Go to Solution.
Hi @rmaddala ,
Based on my research, you could try to use "Ultimate KPI CARD" custom visual to solve your problem:
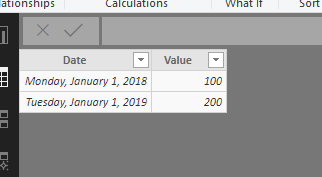
Sample data:
Create below measures:
Current year = CALCULATE(SUM(Table2[Value]),FILTER('Table2',YEAR('Table2'[Date])=YEAR(NOW())))
Last year = CALCULATE(SUM(Table2[Value]),FILTER('Table2',YEAR('Table2'[Date])=YEAR(NOW())-1))
Difference = ([Current year]-[Last year])*1.1
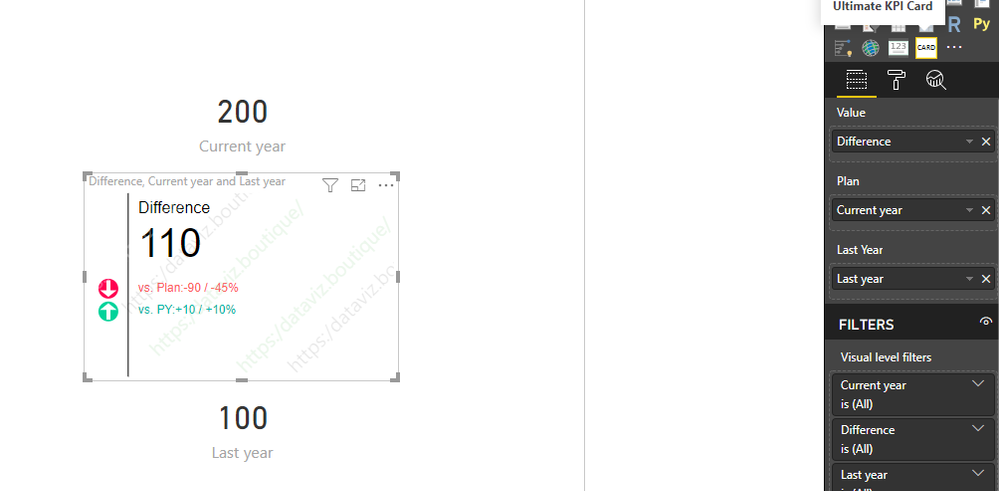
Result:
You could also download the pbix file to have a view.
Regards,
Daniel He
Hi @rmaddala ,
Could you please tell me if your problem has been solved? If it is, could you please mark the helpful replies as Answered to close this topic?
Regards,
Daniel He
Hi @rmaddala ,
Based on my research, you could try to use "Ultimate KPI CARD" custom visual to solve your problem:
Sample data:
Create below measures:
Current year = CALCULATE(SUM(Table2[Value]),FILTER('Table2',YEAR('Table2'[Date])=YEAR(NOW())))
Last year = CALCULATE(SUM(Table2[Value]),FILTER('Table2',YEAR('Table2'[Date])=YEAR(NOW())-1))
Difference = ([Current year]-[Last year])*1.1
Result:
You could also download the pbix file to have a view.
Regards,
Daniel He
Join us in Barcelona for FabCon and SQLCon, the Fabric, Power BI, SQL, and AI community event. Save €200 with code FABCMTY200.
| User | Count |
|---|---|
| 24 | |
| 22 | |
| 20 | |
| 18 | |
| 14 |
| User | Count |
|---|---|
| 29 | |
| 22 | |
| 22 | |
| 20 | |
| 20 |