Fabric Data Days starts November 4th!
Advance your Data & AI career with 50 days of live learning, dataviz contests, hands-on challenges, study groups & certifications and more!
Get registered- Power BI forums
- Get Help with Power BI
- Desktop
- Service
- Report Server
- Power Query
- Mobile Apps
- Developer
- DAX Commands and Tips
- Custom Visuals Development Discussion
- Health and Life Sciences
- Power BI Spanish forums
- Translated Spanish Desktop
- Training and Consulting
- Instructor Led Training
- Dashboard in a Day for Women, by Women
- Galleries
- Data Stories Gallery
- Themes Gallery
- Contests Gallery
- QuickViz Gallery
- Quick Measures Gallery
- Visual Calculations Gallery
- Notebook Gallery
- Translytical Task Flow Gallery
- TMDL Gallery
- R Script Showcase
- Webinars and Video Gallery
- Ideas
- Custom Visuals Ideas (read-only)
- Issues
- Issues
- Events
- Upcoming Events
Get Fabric Certified for FREE during Fabric Data Days. Don't miss your chance! Request now
- Power BI forums
- Forums
- Get Help with Power BI
- Desktop
- Re: Need Help - How to replicate a DAX formula usi...
- Subscribe to RSS Feed
- Mark Topic as New
- Mark Topic as Read
- Float this Topic for Current User
- Bookmark
- Subscribe
- Printer Friendly Page
- Mark as New
- Bookmark
- Subscribe
- Mute
- Subscribe to RSS Feed
- Permalink
- Report Inappropriate Content
Need Help - How to replicate a DAX formula using ALLEXCEPT in Power Query to minimise data load
I'm trying to replicate a DAX formula in Power Query M but struggling a bit. The reason for this exercise is we would prefer to minimise the data pulled into the model. Basically, my company is tracking changes on a large dataset, taking a snapshot every day in a Data warehouse, for numerous fields. I am only interested in the changes on certain fields, and hence want to decrease the dataset size in Power Query before pulling in the data. The dataset is structured as follows:
This is an example for one record (unique id column "Oppid"). There have been 6 changes in total across the dataset since 01/03/22, hence 6 rows appear. The valid_from and valid_to dates show for what dates each row is valid, the row with valid to = 31/12/2099 is the current status of the record.
There are many more columns in the dataset, but I only care about changes in the first 5 columns displayed above. Hence we have duplicate rows which I want to remove, and pull only the minimum valid_from and maximum valid_to dates.
If I do a simple grouping in Power Query, with Min of valid_from and Max of valid_to I get the following result:
This is not what I need - as can be seen in the msdyn_forecastcategory field in the first table, the record Actually moved from "Upside" status, to "Probable" status, back to "Upside" and then back to "Probable". But due to the grouping functionality and the max/min calculation, Power Query can't figure this out. I can achieve what I want with a DAX formula in the model:
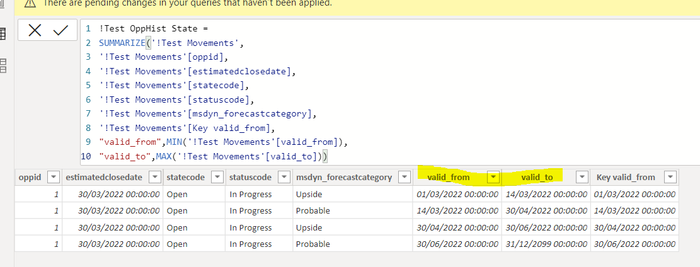
I created a ChangeID column which is a simple concatenation of the 5 columns I need to track changes on, and then a custom column called "Key valid_from" which pulls the minimum valid_from date that I care about (the minimum valid_from date within the context of the ChangeID column, which is smaller or equal to each row's valid_to date).
Then I can safely summarize my table into a new table, including the "Key valid from" column, which behaves like a Unique ID, with the following expected result:
In this table, the 4 changes back and forth from msdyn_forecastcategory are conserved, as well as the accurate valid_from and valid_to dates.
How could I replicate something like this in Power Query M, if I am starting with Table 1 at the top of this post?
Thanks a ton for the help 🙂
Solved! Go to Solution.
- Mark as New
- Bookmark
- Subscribe
- Mute
- Subscribe to RSS Feed
- Permalink
- Report Inappropriate Content
This looks like a GroupKind.Local type of problem.
See Chris Webb's blog or ehansalytics
- Mark as New
- Bookmark
- Subscribe
- Mute
- Subscribe to RSS Feed
- Permalink
- Report Inappropriate Content
Some kind of windowing function using lag and lead with partitions?
I know there is a technique where a pseudo- grouping column is created (You can probably use the ID2 column). I'm sure there's stuff out there on the web
- Mark as New
- Bookmark
- Subscribe
- Mute
- Subscribe to RSS Feed
- Permalink
- Report Inappropriate Content
Thanks - Will look into it! Unfortunately the ID2 column was a manual test column that I was trying to replicate with my DAX formula - not actually in the dataset!
- Mark as New
- Bookmark
- Subscribe
- Mute
- Subscribe to RSS Feed
- Permalink
- Report Inappropriate Content
This looks like a GroupKind.Local type of problem.
See Chris Webb's blog or ehansalytics
- Mark as New
- Bookmark
- Subscribe
- Mute
- Subscribe to RSS Feed
- Permalink
- Report Inappropriate Content
One question though - any idea how one would one achieve something similar with T-SQL and a Group By statement?
- Mark as New
- Bookmark
- Subscribe
- Mute
- Subscribe to RSS Feed
- Permalink
- Report Inappropriate Content
Wow! That worked 😄 Thank you so much!! What a neat trick!
Helpful resources

Fabric Data Days
Advance your Data & AI career with 50 days of live learning, contests, hands-on challenges, study groups & certifications and more!

Power BI Monthly Update - October 2025
Check out the October 2025 Power BI update to learn about new features.


