This is best Fabric, Power BI, SQL and AI community event. How do we know? The last event sold out! Save €200 with code FABCMTY200.
Register nowJuly 28 - August 9 | Final Round of the Power BI Dataviz World Championships. This is your chance. Learn more
hello ,
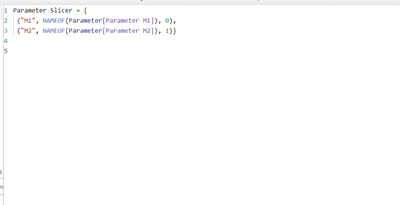
i have created table for multiple meaures , i want to show tabular version of data selecting multiple va;ues in slicer
please help ,thank you in advance
@Anonymous , For that you can sue field parameters or calculation groups
Power BI Field Parameters — A Quick way for Dynamic Visuals: https://amitchandak.medium.com/power-bi-field-parameters-a-quick-way-for-dynamic-visuals-fc4095ae9af...
Power BI Field Parameters- Measure Slicer and Axis/Dimension slicer: https://youtu.be/lqF3Wa1FllE
Switch TOPN with Field Parameters: https://amitchandak.medium.com/switch-topn-with-field-parameters-299a0ae3725f
Calculation Groups- Measure Slicer, Measure Header Grouping, Measure to dimension conversion. Complex Table display : https://youtu.be/qMNv67P8Go0
Join us in Barcelona for FabCon and SQLCon, the Fabric, Power BI, SQL, and AI community event. Save €200 with code FABCMTY200.
If you love stickers, then you will definitely want to check out our community sticker challenge, Barcelona edition!
Check out the July 2026 Power BI update to learn about new features.
| User | Count |
|---|---|
| 25 | |
| 23 | |
| 20 | |
| 18 | |
| 14 |
| User | Count |
|---|---|
| 24 | |
| 20 | |
| 20 | |
| 19 | |
| 19 |