Become a Certified Power BI Data Analyst!
Join us for an expert-led overview of the tools and concepts you'll need to pass exam PL-300. The first session starts on June 11th. See you there!
Get registered- Power BI forums
- Get Help with Power BI
- Desktop
- Service
- Report Server
- Power Query
- Mobile Apps
- Developer
- DAX Commands and Tips
- Custom Visuals Development Discussion
- Health and Life Sciences
- Power BI Spanish forums
- Translated Spanish Desktop
- Training and Consulting
- Instructor Led Training
- Dashboard in a Day for Women, by Women
- Galleries
- Webinars and Video Gallery
- Data Stories Gallery
- Themes Gallery
- Contests Gallery
- Quick Measures Gallery
- Notebook Gallery
- Translytical Task Flow Gallery
- R Script Showcase
- Ideas
- Custom Visuals Ideas (read-only)
- Issues
- Issues
- Events
- Upcoming Events
Power BI is turning 10! Let’s celebrate together with dataviz contests, interactive sessions, and giveaways. Register now.
- Power BI forums
- Forums
- Get Help with Power BI
- Desktop
- Re: Month to Month Stock Inventory
- Subscribe to RSS Feed
- Mark Topic as New
- Mark Topic as Read
- Float this Topic for Current User
- Bookmark
- Subscribe
- Printer Friendly Page
- Mark as New
- Bookmark
- Subscribe
- Mute
- Subscribe to RSS Feed
- Permalink
- Report Inappropriate Content
Month to Month Stock Inventory
Hi there!
New to Power BI
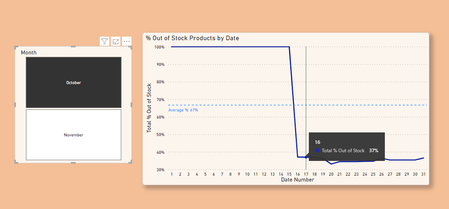
I currently have a report that gives the product stock inventory over a certain time period. My data source that holds the product stock inventory was not active until Oct 16th.
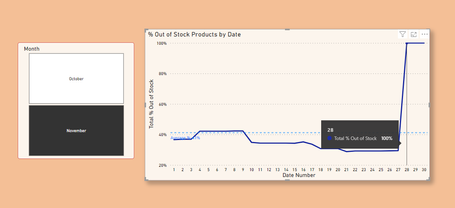
I have a line chart visual showing the percentage of out of stock products on a certain date. I want my visual to adjust depending on the month chosen.
For example, when Oct is selected the graph should begin on the 16th, since that is the beginning of my data source. However, when I have Oct selected, it is showing results from the 1st, saying that 100% of products were out of stock, because again the beginning of my data source is Oct 16th.
Then when the month of Nov is selected, it should have all the available dates with values attached to them. The graph should end on the 27th.
And I can't put filters on these visuals or else I will be missing certain dates in Nov.
Is there a DAX function I can use to apply these changes?
Solved! Go to Solution.
- Mark as New
- Bookmark
- Subscribe
- Mute
- Subscribe to RSS Feed
- Permalink
- Report Inappropriate Content
I see! I used CALENDAR instead of CALENDARAUTO and it solve my issue. Thanks!
- Mark as New
- Bookmark
- Subscribe
- Mute
- Subscribe to RSS Feed
- Permalink
- Report Inappropriate Content
Hi,
The easiest way would be to ensure that the Calendar Table starts from Oct 16 and goes till today. To your visuals/slicers/filters, drag Date from the Calendar Table.
Regards,
Ashish Mathur
http://www.ashishmathur.com
https://www.linkedin.com/in/excelenthusiasts/
- Mark as New
- Bookmark
- Subscribe
- Mute
- Subscribe to RSS Feed
- Permalink
- Report Inappropriate Content
I see! I used CALENDAR instead of CALENDARAUTO and it solve my issue. Thanks!
- Mark as New
- Bookmark
- Subscribe
- Mute
- Subscribe to RSS Feed
- Permalink
- Report Inappropriate Content
@Anonymous , Do you stock snapshot or do you rebuild inventory using purchase and sales
In case snapshot, You can use lastnonblankvalue
calculate(lastnonblankvalue (date[Date], Sum(Table[Inv Value]) , Filter(all(Date), Date[Date] <= max(Date[Date]) ) )
Or you can rebuild using
Inventory / OnHand
CALCULATE(firstnonblankvalue('Date'[Month]),sum(Table[Intial Inventory]),all('Date')) +
CALCULATE(SUM(Table[Ordered]),filter(all(date),date[date] <min(date[date]))) -
CALCULATE(SUM(Table[Sold]),filter(all(date),date[date] <min(date[date])))
Power BI Inventory On Hand: https://youtu.be/nKbJ9Cpb-Aw
Helpful resources
| User | Count |
|---|---|
| 84 | |
| 73 | |
| 67 | |
| 42 | |
| 35 |
| User | Count |
|---|---|
| 109 | |
| 56 | |
| 52 | |
| 45 | |
| 43 |


