This is best Fabric, Power BI, SQL and AI community event. How do we know? The last event sold out! Save €200 with code FABCMTY200.
Register nowJuly 28 - August 9 | Final Round of the Power BI Dataviz World Championships. This is your chance. Learn more
Hi all,
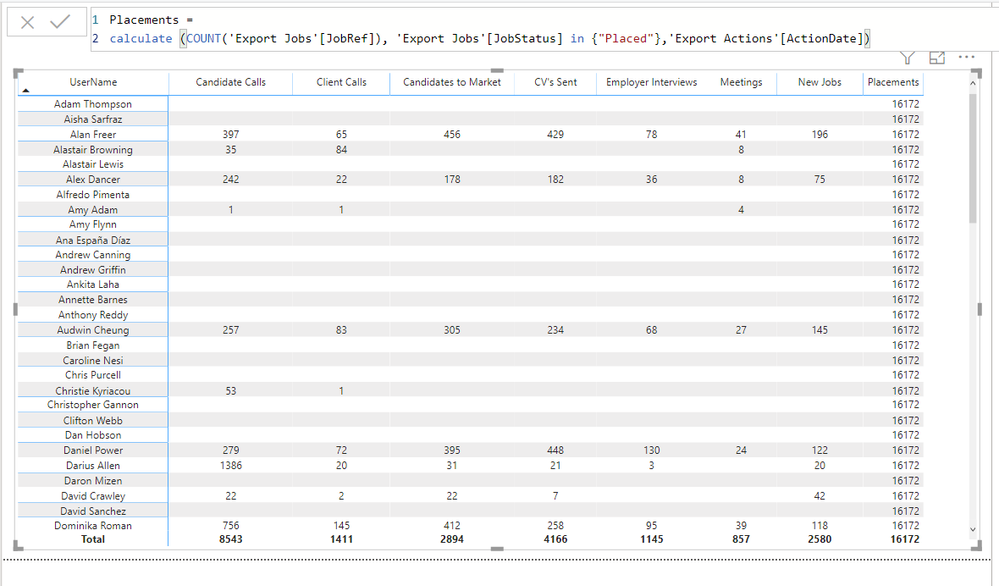
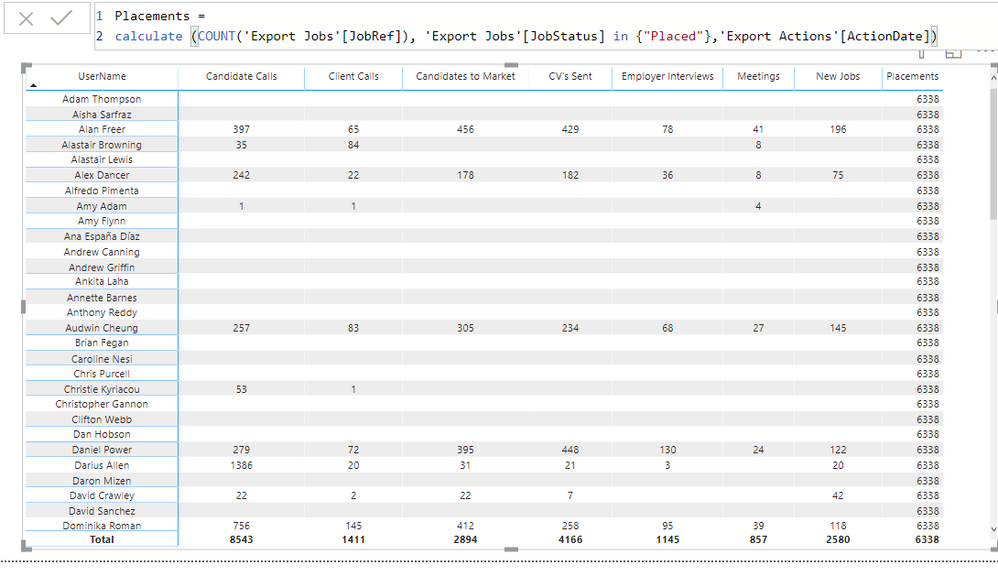
I have created a measure 'Placements' which looks to a different table to all other measures/columns.
It doesn't show the data correctly it only shows the total on every row?
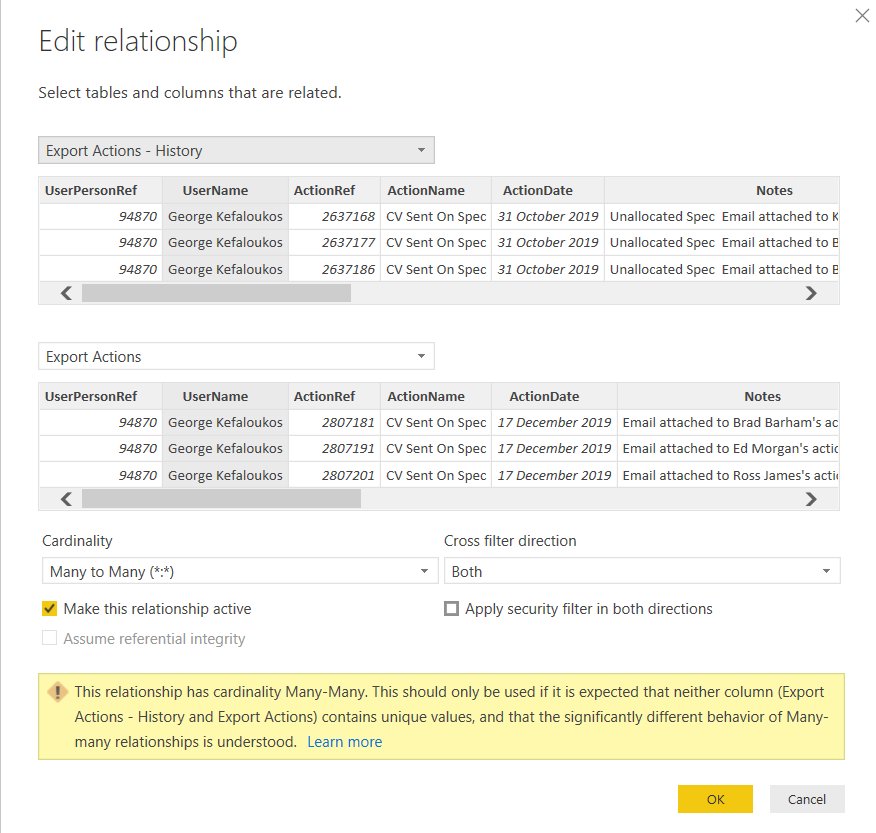
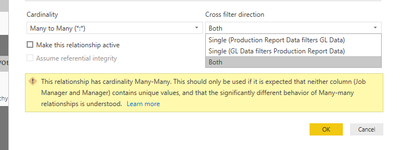
I have created a data connection to UserName as per image 2
please advise
1. Measure
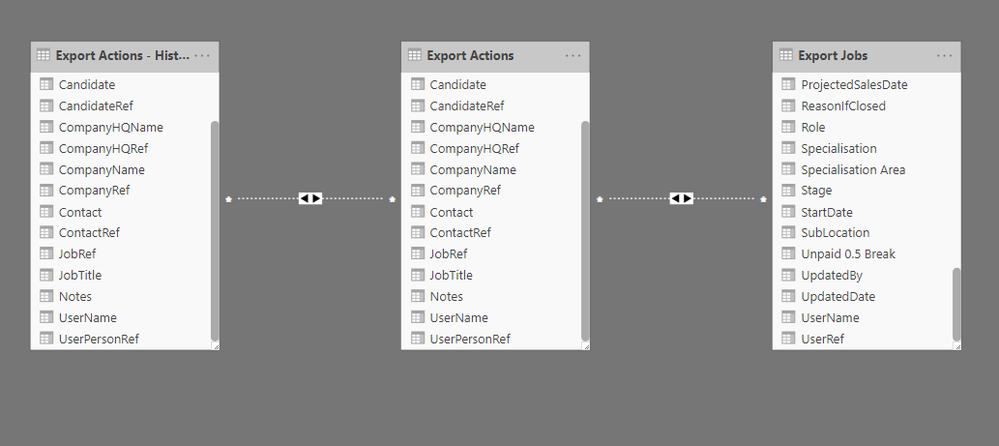
2. Data Relationship
Hi @HenryJS ,
You could set the relationship to be active or use USERELATIONSHIP() function.
Hi @v-eachen-msft @TCarrasquillo
I've made the relationship active but I'm still having the same problem.
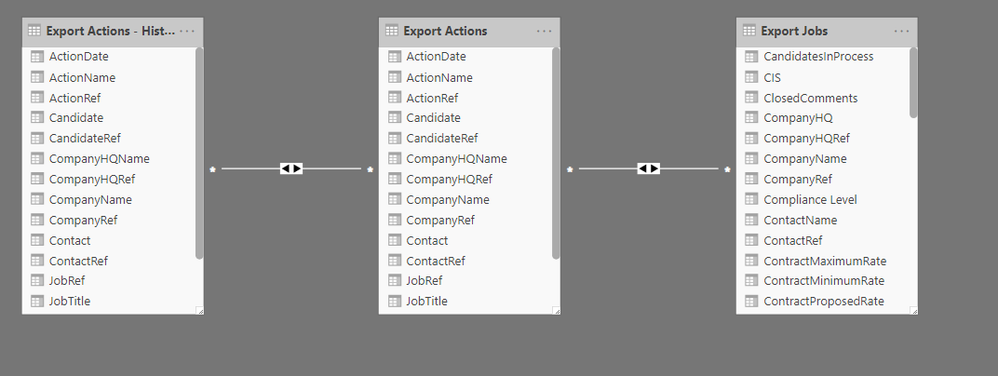
As you can see the Placements measure is looking up to a different table to other measures. I have made a relationship from 'Export Jobs' to the UNION table on username but not getting the required result?
1. Relationship active
2. Edit relationship
3. Placements DAX - looks up to different table
@HenryJS ,
It might be helpful to let everyone know what you are expecting from the measure.
From what it looks like, the formula is looking at the Export Actions table, if you want it to look at a different table, like the Export actions - hist.. table then you need to change that in the dax. It would probably help if the 2 tables didn't have names that were so similar.
Your problem could also be the many to many relationship, if there's no way to make the relationship a 1 to many, then you should try to set the direction based on how you want to filter the tables. See my example below...
Your problem might be that the relationships aren't active, both the lines between your tables are dotted/dashed, meaning inactive.
You might need to figure out how to make at least one of them active.
Join us in Barcelona for FabCon and SQLCon, the Fabric, Power BI, SQL, and AI community event. Save €200 with code FABCMTY200.
If you love stickers, then you will definitely want to check out our community sticker challenge, Barcelona edition!
Check out the July 2026 Power BI update to learn about new features.
| User | Count |
|---|---|
| 25 | |
| 23 | |
| 19 | |
| 17 | |
| 14 |
| User | Count |
|---|---|
| 25 | |
| 23 | |
| 20 | |
| 20 | |
| 19 |