This is best Fabric, Power BI, SQL and AI community event. How do we know? The last event sold out! Save €200 with code FABCMTY200.
Register nowThe Fabric community is now in read-only for platform upgrade. Learn more
I'm trying to get a matrix table into the format below where my rows are my metrics and I have two column hierarchies: Time and Current/Prior. For each metric I want to have the raw values for "Current" and then a %increase/decrease in the "Prior" column.
This data is coming via DirectQuery from SQL and it looks like this:
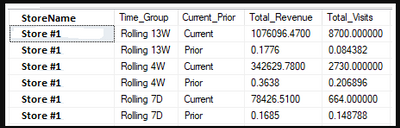
I'm doing the % calculation in the SQL query, but if it's easier to create a measure to do that work then I can pull in the raw values.
Ideally what I need is the ability to have the Current values be formatted as currency and the prior values formatted as a percent. Unfortunately I can't use the FORMAT() function with direct query so that's off the table. Is there any other way to achieve this?
Solved! Go to Solution.
What I wound up doing was reformatting the SQL code to look like this:

That way Current/Prior are have two separate values and the "metric" is categorical. I got the idea from this post: Simple way to transpose columns and rows in SQL?
What I wound up doing was reformatting the SQL code to look like this:

That way Current/Prior are have two separate values and the "metric" is categorical. I got the idea from this post: Simple way to transpose columns and rows in SQL?
@Anonymous,
You might try using a calculation group. Each calculation item within a calculation group has a format property.
https://www.sqlbi.com/articles/controlling-format-strings-in-calculation-groups/
Proud to be a Super User!
Join us in Barcelona for FabCon and SQLCon, the Fabric, Power BI, SQL, and AI community event. Save €200 with code FABCMTY200.
| User | Count |
|---|---|
| 23 | |
| 22 | |
| 14 | |
| 14 | |
| 13 |
| User | Count |
|---|---|
| 47 | |
| 39 | |
| 24 | |
| 22 | |
| 20 |