cancel
Showing results for 
Search instead for 
Did you mean: 

July 7 - July 17 | Round 2 of the Power BI Dataviz World Championships. Don't miss your chance! Learn more

Reply
nirrobi
Helper V
Helper V

Matrix differences

Dear all,


I need to create table that show the differences between data in matrix.

MATRIXABCDE
A 100557788
B-25 55-70055
C55-33 5522
D7766855 2
E8833-5555 

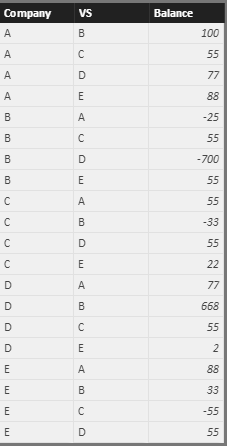
I have for example the below data (company, other company, balance vs other company)

CompanyVSBalance
AB100
AC55
AD77
AE88
BA-25
BC55
BD-700
BE55
CA55
CB-33
CD55
CE22
DA77
DB668
DC55
DE2
EA88
EB33
EC-55
ED55


for example:

   company A think that company B owe her 100

   company B think that  her debt is onlt 25 (-25)


the input should be something like this:

CompanyVSCompanyVSDIFF
AB100-2575
AC5555110
AD7777154
AE8888176
BC55-3322
BD-700668-32
BE553388
CD5555110
CE22-55-33
DE25557
total   727


what should be the measure for DIFF column?


thanks a lot for your help!


Nir.

1 ACCEPTED SOLUTION
Anonymous
Not applicable

Hi @nirrobi,


Based on your description, you want to get the diff between current balance and compared companies’ balance, right?

If it is a case, you can refer to below steps:

Data table:

Capture2.PNG


Measure: get the comparison companies’ balances


Comparison companies =
var currCom=LASTNONBLANK(Sheet1[Company],Sheet1[Company])
var currVS=LASTNONBLANK(Sheet1[VS],Sheet1[VS])
return
LOOKUPVALUE(Sheet1[Balance],Sheet1[Company],currVS,Sheet1[VS],currCom)


Measure: get the diff balance:

diff measure = var currBalance= MAX(Sheet1[Balance])
return
currBalance + [Comparison companies]

Result: (I drag these columns and measures to a table visual)


 Capture.PNG


Notice: the measure works when the balance is not blank.


Regards,
Xiaoxin Sheng


View solution in original post

5 REPLIES 5
Anonymous
Not applicable

Hi @nirrobi,


Based on your description, you want to get the diff between current balance and compared companies’ balance, right?

If it is a case, you can refer to below steps:

Data table:

Capture2.PNG


Measure: get the comparison companies’ balances


Comparison companies =
var currCom=LASTNONBLANK(Sheet1[Company],Sheet1[Company])
var currVS=LASTNONBLANK(Sheet1[VS],Sheet1[VS])
return
LOOKUPVALUE(Sheet1[Balance],Sheet1[Company],currVS,Sheet1[VS],currCom)


Measure: get the diff balance:

diff measure = var currBalance= MAX(Sheet1[Balance])
return
currBalance + [Comparison companies]

Result: (I drag these columns and measures to a table visual)


 Capture.PNG


Notice: the measure works when the balance is not blank.


Regards,
Xiaoxin Sheng


I am speechless!

thank.

Work like a charm.


Do you know a way that there wont be duplicate of comaprison?

for example A vs B is exactly the same as B vs A, so I dont want to show it twice.

Anonymous
Not applicable

Hi @nirrobi,


I think you can simply use distinct function to filter the duplicate records.


Table = DISTINCT(old table)


Then use new tables columns and measure to create the visual.


Regards,

Xiaoxin Sheng

Hi,


for which column?

I cant do it for column diff as AvsB can be equal to column DvsE for example.

Anonymous
Not applicable

Hi @nirrobi,


The function can also works on table.

I have modified the above reply and add a sample.


Regards,

Xiaoxin Sheng

Helpful resources

Announcements
FabCon and SQLCon Barcelona 2026

FabCon & SQLCon – Barcelona 2026

Join us in Barcelona for FabCon and SQLCon, the Fabric, Power BI, SQL, and AI community event. Save €200 with code FABCMTY200.

60 days of Data Days Carousel

Data Days 2026

Join Data Days 2026: 60 days of free live/on-demand sessions, challenges, study groups, and certification opportunities.

Power BI DataViz World Championships carousel

Power BI DataViz World Championships - June 2026

A new Power BI DataViz World Championship is coming this June! Don't miss out on submitting your entry.

Top Solution Authors