

This is best Fabric, Power BI, SQL and AI community event. How do we know? The last event sold out! Save €200 with code FABCMTY200.
Register nowA new Data Days event is coming soon! This time we’re going bigger than ever. Fabric, Power BI, SQL, AI and more. Don't miss out.
Hello, I am trying to create a Power BI Matrix from sales data that looks like:
To create a summary, by sales person, by count of their role in a sale:
I'm probably overthinking this, but can't seem to elegantly accomplish this without building side tables which extract each role and person and then merging those tables together. Anyone have ideas on this?
Solved! Go to Solution.
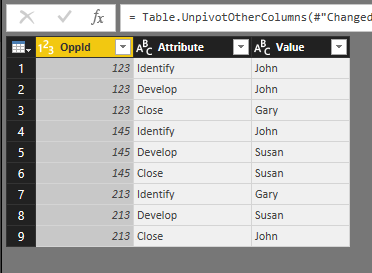
Hi, in Edit Query Select the 3 columns (Except Opp ID) and Transform Unpivot Columns.
You'll obtain something like this:
Change the name of the Columns. Close & Apply
Finally in a Matrix
Hi, in Edit Query Select the 3 columns (Except Opp ID) and Transform Unpivot Columns.
You'll obtain something like this:
Change the name of the Columns. Close & Apply
Finally in a Matrix
You aren't going to get away from building a separate person table. Once you have done that you can probably write measures --
Total Id := DISTINCTCOUNT(MyTable[Identify])
Total Develop := DISTINCTCOUNT(MyTable[Develop])
...
Check out the May 2026 Power BI update to learn about new features.
Sign up to receive a private message when registration opens and key events begin.
If you have recently started exploring Fabric, we'd love to hear how it's going. Your feedback can help with product improvements.
| User | Count |
|---|---|
| 32 | |
| 26 | |
| 25 | |
| 24 | |
| 15 |
| User | Count |
|---|---|
| 63 | |
| 48 | |
| 27 | |
| 23 | |
| 20 |