Join us in Barcelona for FabCon and SQLCon, September 28 - October 1, 2026.
This is best Fabric, Power BI, SQL and AI community event. How do we know? The last event sold out! Save €200 with code FABCMTY200.
Register now- Power BI forums
- Get Help with Power BI
- Desktop
- Service
- Report Server
- Power Query
- Mobile Apps
- Developer
- DAX Commands and Tips
- Custom Visuals Development Discussion
- Health and Life Sciences
- Power BI Spanish forums
- Translated Spanish Desktop
- Training and Consulting
- Instructor Led Training
- Dashboard in a Day for Women, by Women
- Galleries
- Data Stories Gallery
- Themes Gallery
- Contests Gallery
- QuickViz Gallery
- Quick Measures Gallery
- Visual Calculations Gallery
- Fabric Apps Gallery
- Notebook Gallery
- Translytical Task Flow Gallery
- TMDL Gallery
- R Script Showcase
- Webinars and Video Gallery
- Ideas
- Custom Visuals Ideas (read-only)
- Issues
- Issues
- Events
- Upcoming Events
July 28 - August 9 | Final Round of the Power BI Dataviz World Championships. This is your chance. Learn more
- Power BI forums
- Forums
- Get Help with Power BI
- Desktop
- Re: Matrix Custom Sort
- Subscribe to RSS Feed
- Mark Topic as New
- Mark Topic as Read
- Float this Topic for Current User
- Bookmark
- Subscribe
- Printer Friendly Page

- Mark as New
- Bookmark
- Subscribe
- Mute
- Subscribe to RSS Feed
- Permalink
- Report Inappropriate Content
Matrix Custom Sort
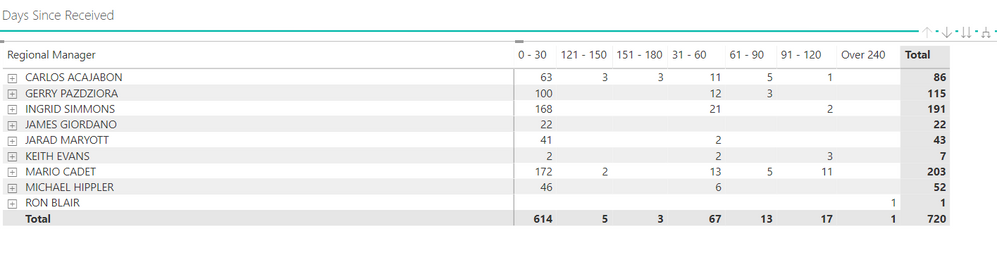
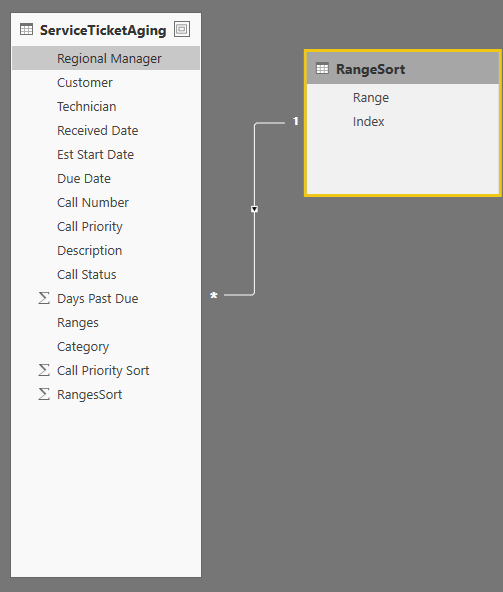
I am unable to figure out how to sort this matrix based on the date ranges below. I have tried a custom sort but that did not seem to work. Any ideas?
Solved! Go to Solution.
- Mark as New
- Bookmark
- Subscribe
- Mute
- Subscribe to RSS Feed
- Permalink
- Report Inappropriate Content
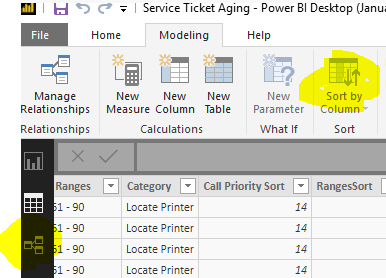
You could use the "Sort by Column" icon (just select the field you want to sort first):
Or, click the 3rd icon on the left:
- Mark as New
- Bookmark
- Subscribe
- Mute
- Subscribe to RSS Feed
- Permalink
- Report Inappropriate Content
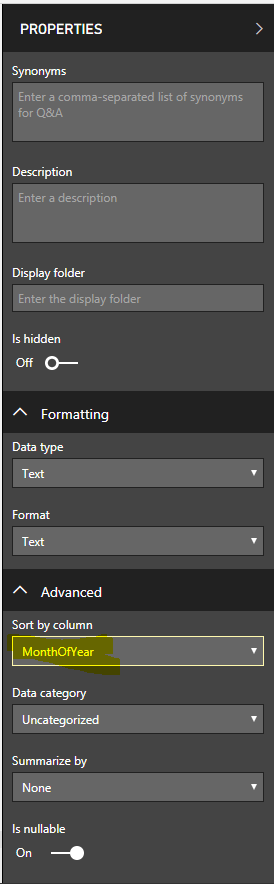
On the Modeling View, in the field list, select Range, then set the Sort by Column to the Index.
Hope this helps,
Nathan
- Mark as New
- Bookmark
- Subscribe
- Mute
- Subscribe to RSS Feed
- Permalink
- Report Inappropriate Content
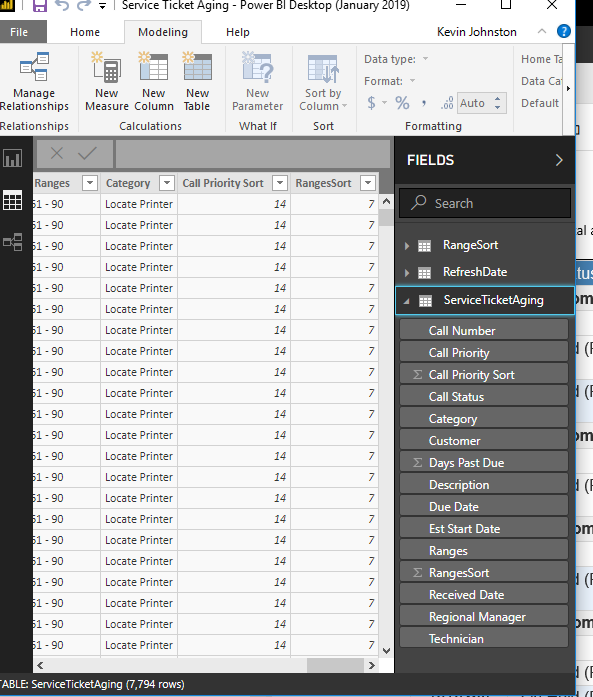
Nathan,
I'm not sure how you got to that screen.
- Mark as New
- Bookmark
- Subscribe
- Mute
- Subscribe to RSS Feed
- Permalink
- Report Inappropriate Content
Your date ranges are all in the "value" section of the matrix correct?
- Mark as New
- Bookmark
- Subscribe
- Mute
- Subscribe to RSS Feed
- Permalink
- Report Inappropriate Content
No, I am trying to get a count of Service Calls within a certain range, 0-30, 31-60.....

- Mark as New
- Bookmark
- Subscribe
- Mute
- Subscribe to RSS Feed
- Permalink
- Report Inappropriate Content
I believe this is a similar issue to yours.
https://community.powerbi.com/t5/Desktop/Filtering-matrix-rows-by-a-column-value/td-p/225092
- Mark as New
- Bookmark
- Subscribe
- Mute
- Subscribe to RSS Feed
- Permalink
- Report Inappropriate Content
I will give this a try.
- Mark as New
- Bookmark
- Subscribe
- Mute
- Subscribe to RSS Feed
- Permalink
- Report Inappropriate Content
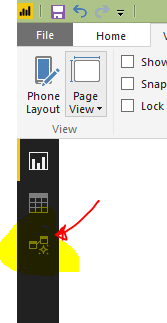
You can get to the Modeling View with this icon:
- Mark as New
- Bookmark
- Subscribe
- Mute
- Subscribe to RSS Feed
- Permalink
- Report Inappropriate Content
OK, I belive I know why I do not see that icon, it's because I am using a version optimized to allow me to save to our Power BI Report Server.


- Mark as New
- Bookmark
- Subscribe
- Mute
- Subscribe to RSS Feed
- Permalink
- Report Inappropriate Content
The Matrix visual lacks functionality. There are lots of ideas on the community site. Below are the front runners. Please vote these up!
- Mark as New
- Bookmark
- Subscribe
- Mute
- Subscribe to RSS Feed
- Permalink
- Report Inappropriate Content
I must have an older version as I do not have that icon.
- Mark as New
- Bookmark
- Subscribe
- Mute
- Subscribe to RSS Feed
- Permalink
- Report Inappropriate Content
You could use the "Sort by Column" icon (just select the field you want to sort first):
Or, click the 3rd icon on the left:
Helpful resources

FabCon & SQLCon – Barcelona 2026
Join us in Barcelona for FabCon and SQLCon, the Fabric, Power BI, SQL, and AI community event. Save €200 with code FABCMTY200.

Fabric Community Sticker Challenge - Barcelona 2026
If you love stickers, then you will definitely want to check out our community sticker challenge, Barcelona edition!

Power BI Monthly Update - July 2026
Check out the July 2026 Power BI update to learn about new features.

Power BI DataViz World Championships - June 2026
A new Power BI DataViz World Championship is coming this June! Don't miss out on submitting your entry.

| User | Count |
|---|---|
| 25 | |
| 23 | |
| 19 | |
| 17 | |
| 14 |


| User | Count |
|---|---|
| 24 | |
| 23 | |
| 20 | |
| 20 | |
| 19 |


