cancel
Showing results for 
Search instead for 
Did you mean: 

July 7 - July 17 | Round 2 of the Power BI Dataviz World Championships. Don't miss your chance! Learn more

Reply
jscivias
Helper I
Helper I

Map isn't plotting all data points

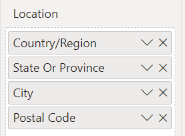
Hello, I have a dataset with separate columns for Country, State, City, and Postal code information as follows:


jscivias_5-1658168682774.png


When I include all these fields under 'location', many countries don't show up (e.g. Japan, United Kingdom, and other countries where my data don't have postal code or state data). When I omit State and postal code information and only include country and city fields, most data points are plotted in the correct location, including those countries with missing state info, but so many of my US data don't get plotted correctly-- e.g. a city in state X gets mapped to state Y, etc. I am not sure how to get around this issue. Is there a way I can include the state field, and for those entries where I have missing state info, force power BI to just consider the city level info? (get the data to show up just as they did when i included only country and city fields? Thanks for your help. 


1 ACCEPTED SOLUTION
Greg_Deckler
Community Champion
Community Champion

@jscivias I have often found that concatenating this kind of information into a single field and then setting the data category to Place helps resolve a lot of map plotting issues.


Follow on LinkedIn
@ me in replies or I'll lose your thread!!!
Instead of a Kudo, please vote for this idea
Become an expert!: Enterprise DNA
External Tools: MSHGQM
YouTube Channel!: Microsoft Hates Greg
Latest book!:
DAX For Humans

DAX is easy, CALCULATE makes DAX hard...

View solution in original post

2 REPLIES 2
Greg_Deckler
Community Champion
Community Champion

@jscivias I have often found that concatenating this kind of information into a single field and then setting the data category to Place helps resolve a lot of map plotting issues.


Follow on LinkedIn
@ me in replies or I'll lose your thread!!!
Instead of a Kudo, please vote for this idea
Become an expert!: Enterprise DNA
External Tools: MSHGQM
YouTube Channel!: Microsoft Hates Greg
Latest book!:
DAX For Humans

DAX is easy, CALCULATE makes DAX hard...

@Greg_Deckler thanks for the concatenation suggestion, it did solve a bulk of data points that were randomly mis plotted all over the place on the map! 

Helpful resources

Announcements
FabCon and SQLCon Barcelona 2026

FabCon & SQLCon – Barcelona 2026

Join us in Barcelona for FabCon and SQLCon, the Fabric, Power BI, SQL, and AI community event. Save €200 with code FABCMTY200.

60 days of Data Days Carousel

Data Days 2026

Join Data Days 2026: 60 days of free live/on-demand sessions, challenges, study groups, and certification opportunities.

Power BI DataViz World Championships carousel

Power BI DataViz World Championships - June 2026

A new Power BI DataViz World Championship is coming this June! Don't miss out on submitting your entry.

Top Solution Authors