Fabric Data Days starts November 4th!
Advance your Data & AI career with 50 days of live learning, dataviz contests, hands-on challenges, study groups & certifications and more!
Get registered- Power BI forums
- Get Help with Power BI
- Desktop
- Service
- Report Server
- Power Query
- Mobile Apps
- Developer
- DAX Commands and Tips
- Custom Visuals Development Discussion
- Health and Life Sciences
- Power BI Spanish forums
- Translated Spanish Desktop
- Training and Consulting
- Instructor Led Training
- Dashboard in a Day for Women, by Women
- Galleries
- Data Stories Gallery
- Themes Gallery
- Contests Gallery
- Quick Measures Gallery
- Visual Calculations Gallery
- Notebook Gallery
- Translytical Task Flow Gallery
- TMDL Gallery
- R Script Showcase
- Webinars and Video Gallery
- Ideas
- Custom Visuals Ideas (read-only)
- Issues
- Issues
- Events
- Upcoming Events
Get Fabric Certified for FREE during Fabric Data Days. Don't miss your chance! Learn more
- Power BI forums
- Forums
- Get Help with Power BI
- Desktop
- Re: How to subtract a group of variables from a co...
- Subscribe to RSS Feed
- Mark Topic as New
- Mark Topic as Read
- Float this Topic for Current User
- Bookmark
- Subscribe
- Printer Friendly Page
- Mark as New
- Bookmark
- Subscribe
- Mute
- Subscribe to RSS Feed
- Permalink
- Report Inappropriate Content
How to subtract a group of variables from a column
Dear Community,
I am a new user and working on my first dashboard in Power BI. The file I got has data in weekly frequentcy from different departments, these are all sorted on date. One column is the amount of employees from the department on that specific date, I want to calculate what the total amount of workers is on that date and how many percentage of the total employees are working for that department.
The table is like this
Column A(Date) Column B(Departement) Column C (Profiles,which is how many people there are) Column D (Variable X)
19-02-2017 Department A 8
19-02-2017 Department B 9
19-02-2017 Department C 293
26-02-2017 Department A 15
26-02-2017 Department B 8
26-02-2017 Department C 300
So I want to calculate
Total Employees on that date
Percentage of employees working for that department on that date
Thanks in advance,
0xygen27
- Mark as New
- Bookmark
- Subscribe
- Mute
- Subscribe to RSS Feed
- Permalink
- Report Inappropriate Content
Hi @0xygen27
Try the following
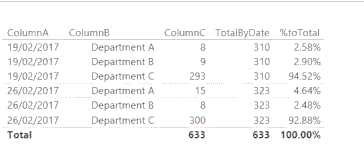
1. Create a measure called TotalByDate
TotalByDate = Calculate(sum(Table3[ColumnC]), ALLEXCEPT(Table3,Table3[ColumnA]))
2. Createa measure called %toTotal
%toTotal = Divide(sum(Table3[ColumnC]),[TotalByDate])
Replace all Table3 by your tablename. Sample output with the data provided by you.

If this resolves your issue, please accept it as a solution and also give KUDOS.
Cheers
CheenuSing
- Mark as New
- Bookmark
- Subscribe
- Mute
- Subscribe to RSS Feed
- Permalink
- Report Inappropriate Content
Hi @0xygen27,
You can try to use below formula which about calculate the running total:
Measure:
Running total=
var currDepart= LASTNONBLANK(Table[Department],[Department])
return
SUMX(FILTER(ALLSELECTED(Table),Table[Department]=currDepart&&Table[Date]<=MAX(Table[Date])),[Profiles])
Regards,
Xiaoxin Sheng
- Mark as New
- Bookmark
- Subscribe
- Mute
- Subscribe to RSS Feed
- Permalink
- Report Inappropriate Content
Power BI gives me the return: The MAX function only accepts a column reference as an argument.
- Mark as New
- Bookmark
- Subscribe
- Mute
- Subscribe to RSS Feed
- Permalink
- Report Inappropriate Content
Hi @0xygen27,
>>Power BI gives me the return: The MAX function only accepts a column reference as an argument.
Can you share us your formula?
Regards,
Xiaoxin Sheng
- Mark as New
- Bookmark
- Subscribe
- Mute
- Subscribe to RSS Feed
- Permalink
- Report Inappropriate Content
Running total = var currDepart= LASTNONBLANK('database'[Profiel],'database')
return
SUMX(FILTER(ALLSELECTED('database'),'database'[Profiel]
=currDepart&&RELATEDTABLE(Datedimension)<=MAX(Datedimension)),'database'[Profiel])
- Mark as New
- Bookmark
- Subscribe
- Mute
- Subscribe to RSS Feed
- Permalink
- Report Inappropriate Content
Hi @0xygen27,
>>RELATEDTABLE(Datedimension)<=MAX(Datedimension)
You need to specify a column from that table, max function not works on table.
In addition, if your visual has created from different table, it will be help if you share some sample data.
Regards,
Xiaoxin Sheng
Helpful resources

Fabric Data Days
Advance your Data & AI career with 50 days of live learning, contests, hands-on challenges, study groups & certifications and more!

Power BI Monthly Update - October 2025
Check out the October 2025 Power BI update to learn about new features.

| User | Count |
|---|---|
| 84 | |
| 49 | |
| 38 | |
| 31 | |
| 30 |
