Fabric Data Days starts November 4th!
Advance your Data & AI career with 50 days of live learning, dataviz contests, hands-on challenges, study groups & certifications and more!
Get registered- Power BI forums
- Get Help with Power BI
- Desktop
- Service
- Report Server
- Power Query
- Mobile Apps
- Developer
- DAX Commands and Tips
- Custom Visuals Development Discussion
- Health and Life Sciences
- Power BI Spanish forums
- Translated Spanish Desktop
- Training and Consulting
- Instructor Led Training
- Dashboard in a Day for Women, by Women
- Galleries
- Data Stories Gallery
- Themes Gallery
- Contests Gallery
- QuickViz Gallery
- Quick Measures Gallery
- Visual Calculations Gallery
- Notebook Gallery
- Translytical Task Flow Gallery
- TMDL Gallery
- R Script Showcase
- Webinars and Video Gallery
- Ideas
- Custom Visuals Ideas (read-only)
- Issues
- Issues
- Events
- Upcoming Events
Get Fabric Certified for FREE during Fabric Data Days. Don't miss your chance! Request now
- Power BI forums
- Forums
- Get Help with Power BI
- Desktop
- How to show Current Month and Previous Month Data ...
- Subscribe to RSS Feed
- Mark Topic as New
- Mark Topic as Read
- Float this Topic for Current User
- Bookmark
- Subscribe
- Printer Friendly Page
- Mark as New
- Bookmark
- Subscribe
- Mute
- Subscribe to RSS Feed
- Permalink
- Report Inappropriate Content
How to show Current Month and Previous Month Data for Selected Month

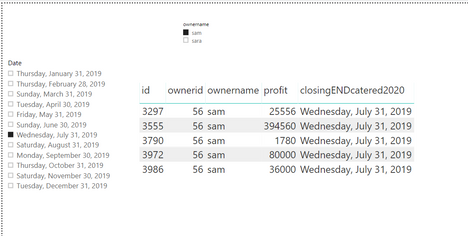
I Have Date Table that has relation ship with other sales data table
I want when I press July the data from Jan until July appear
so for example in the image when I press July, the closingendcatered column will include data from Jan until July
pbix file:
https://www.dropbox.com/s/upz9cbtsvfc48b9/demo.pbix?dl=0
Solved! Go to Solution.
- Mark as New
- Bookmark
- Subscribe
- Mute
- Subscribe to RSS Feed
- Permalink
- Report Inappropriate Content
Hi @myou ,
Firstly, we should make the relationship between fact table and date table inactive. Atfer that, to create a measure as below and add it to the table visual.
Measure =
VAR maxdate =
    SELECTEDVALUE ( Dates[Date] )
RETURN
    IF ( MAX ( Table1[closingENDcatered2020] ) <= maxdate, 1, BLANK () )
If this post helps, then please consider Accept it as the solution to help the others find it more quickly.
Helpful resources

Power BI Monthly Update - November 2025
Check out the November 2025 Power BI update to learn about new features.

Fabric Data Days
Advance your Data & AI career with 50 days of live learning, contests, hands-on challenges, study groups & certifications and more!

| User | Count |
|---|---|
| 93 | |
| 70 | |
| 50 | |
| 40 | |
| 39 |

