Fabric Data Days starts November 4th!
Advance your Data & AI career with 50 days of live learning, dataviz contests, hands-on challenges, study groups & certifications and more!
Get registered- Power BI forums
- Get Help with Power BI
- Desktop
- Service
- Report Server
- Power Query
- Mobile Apps
- Developer
- DAX Commands and Tips
- Custom Visuals Development Discussion
- Health and Life Sciences
- Power BI Spanish forums
- Translated Spanish Desktop
- Training and Consulting
- Instructor Led Training
- Dashboard in a Day for Women, by Women
- Galleries
- Data Stories Gallery
- Themes Gallery
- Contests Gallery
- QuickViz Gallery
- Quick Measures Gallery
- Visual Calculations Gallery
- Notebook Gallery
- Translytical Task Flow Gallery
- TMDL Gallery
- R Script Showcase
- Webinars and Video Gallery
- Ideas
- Custom Visuals Ideas (read-only)
- Issues
- Issues
- Events
- Upcoming Events
Get Fabric Certified for FREE during Fabric Data Days. Don't miss your chance! Request now
- Power BI forums
- Forums
- Get Help with Power BI
- Desktop
- Re: Row total not working when using % calculation...
- Subscribe to RSS Feed
- Mark Topic as New
- Mark Topic as Read
- Float this Topic for Current User
- Bookmark
- Subscribe
- Printer Friendly Page
- Mark as New
- Bookmark
- Subscribe
- Mute
- Subscribe to RSS Feed
- Permalink
- Report Inappropriate Content
How to get "row total" instead of Row Calculation (Row total not working when using % calculations)
The problem :
I have a site lets call it 100
on site 100 i have 4 different costs (maintaines, rent, pay,,,,) but lets call them Cost 1..Cost4
on site 100 i have 4 product segments, but this take op more or less space and time so i want to distribute the cost pr segment.
To do this I have made a table of how much each should pay in % of the cost:
Great
Now i have made a messure that Sum(cost)/100 * % to carry all good
so For eksample cost 1 is 100, segment A should carry 95% = 5$
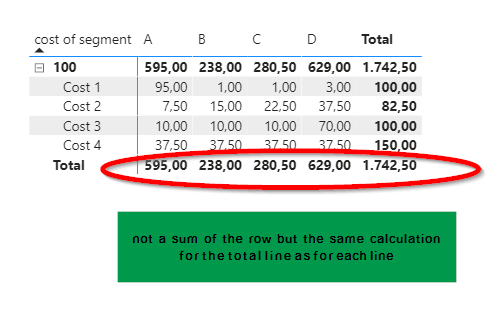
GREAT ... Except the row total i very wrong from my point of view, I ofc would like to know the total cost of Segment A in $
so it should have been 95$+7,5$+10$+37,50$ = 150$
I understand why this happen - and i know i have to make a new table that calculate this pr row I just have now clue how to do this.
the real world problem is a bit more complex, on eacn site there are different departments, each cost is composed of perhaps 100 accounts, each segment holds perhaps 40 sub-divisions and so on. (and ofc there is the whole time issue, since everything has dates - except the cost distribution in %... this get updated every Quarter.
The very simple Version:
In this version i could just make a new column in the distribution of cost table - this would make it work
But in the real world i cant since expences are related to a date, so I need to be able to select a date, hence 1 absoulute number would only be right for 1 specifik period
Solved! Go to Solution.
- Mark as New
- Bookmark
- Subscribe
- Mute
- Subscribe to RSS Feed
- Permalink
- Report Inappropriate Content
Is this what you are after?
If so, the problem was the many-to-many relationship in your model.
I've changed the model to this:
The final measure to distribute the costs is a simple SUMX function:
Distrib Cost = SUMX('Dim Cost', [Sum amount] * [% Carry])
I've attached the PBIX file for your reference
Did I answer your question? Mark my post as a solution!
In doing so, you are also helping me. Thank you!
Proud to be a Super User!
Paul on Linkedin.
- Mark as New
- Bookmark
- Subscribe
- Mute
- Subscribe to RSS Feed
- Permalink
- Report Inappropriate Content
Hi @Rygaard - can you share some of your measure codes and possibly a bit of sample data in a format where we can copy it? You will likely need to modify the measures to do different calculations at different summary levels (using something like HASONEVALUE(), since, as you've realized, Power BI tables don't aggregate the lowest level, they re-calculate in the "total" context.
David
- Mark as New
- Bookmark
- Subscribe
- Mute
- Subscribe to RSS Feed
- Permalink
- Report Inappropriate Content
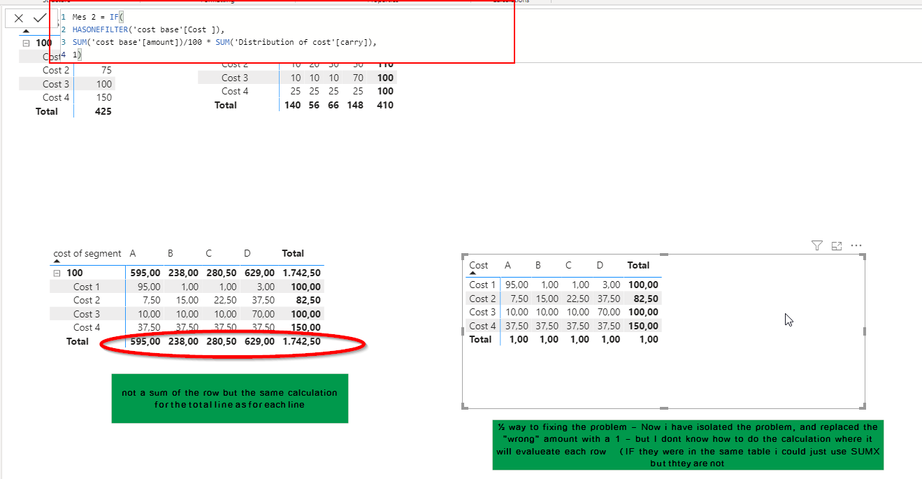
½ way to fixing the problem - Now i have isolated the problem, and replaced the "wrong" amount with a 1 - but I dont know how to do the calculation where it will evalueate each row (IF they were in the same table i could just use SUMX but thtey are not
How strange the file type .pbix is not supported.. so i cant add my pbix file
@dedelman_clng the link above is to my pbix
- Mark as New
- Bookmark
- Subscribe
- Mute
- Subscribe to RSS Feed
- Permalink
- Report Inappropriate Content
Hi @Rygaard ,
Is there a reason that you are over allocating costs, 'Costs 2' has a total of 110, should it not be 100?
I hope this helps,
Richard
Did I answer your question? Mark my post as a solution! Kudos Appreciated!
Proud to be a Super User!
- Mark as New
- Bookmark
- Subscribe
- Mute
- Subscribe to RSS Feed
- Permalink
- Report Inappropriate Content
mistake.. but make ZERO difference the problem remains the same...
(and you could emagin a scenarion wher eyou wanted your cost covered 110 % ... witch would mean you made a profit 😉 )
- Mark as New
- Bookmark
- Subscribe
- Mute
- Subscribe to RSS Feed
- Permalink
- Report Inappropriate Content
Hi @Rygaard,
I think the issue lies in the way you have modelled the data, your facts are not defined down to the item level, what you have called 'Groupe'. If you transform the data to include a row for every 'groupe' which includes the total site cost and the item allocation you can derived the carried amount without having to use two tables with a many to many join. I get that this is a simplistic scenarion which does not include dates and other dimensionality, but your initial problem will only get more painful if you do not model the data in a way that Power BI is best suited. Facts and Dimensions. In the link below you will find a pbix that merges your data using power query and derives the allocated cost in the fact table.
Hope this Helps,
Richard
Did I answer your question? Mark my post as a solution!
Did my answers help arrive at a solution? Give it a kudos by clicking the Thumbs Up!
I hope this helps,
Richard
Did I answer your question? Mark my post as a solution! Kudos Appreciated!
Proud to be a Super User!
- Mark as New
- Bookmark
- Subscribe
- Mute
- Subscribe to RSS Feed
- Permalink
- Report Inappropriate Content
@richbenmintz - dont worry I have a solid structure on the in the real world where items are in a table with no dublicates and so on.
The reason i can not simply do a calculated collumn as you did is that the real cost relates to dates million of lines.
and the "carry %" is updated once every quarter ...
I could for each line in the cost table do a "what is the % it needs right now" - but this lock it ... so i cant change the data set for the Carry % ... but i gues i have to do this and make it static 😞
- Mark as New
- Bookmark
- Subscribe
- Mute
- Subscribe to RSS Feed
- Permalink
- Report Inappropriate Content
Hi @Rygaard,
I would suggest that at the fact level you have a carry_pct_date column and an item column and likely a carry_pct_item_key, You could then create a table that included the item_carry_pct, the carry_pct_date and the carry_pct_item_key. Relate the fact to the ratio lookup table on the carry_pct_item_key and create a measure like
carry cost = sumx('facts', divide(fact[amount], related('rate_lookup'[itm_carry_pct]))
Good Luck
Richard
Did I answer your question? Mark my post as a solution!
Did my answers help arrive at a solution? Give it a kudos by clicking the Thumbs Up!
I hope this helps,
Richard
Did I answer your question? Mark my post as a solution! Kudos Appreciated!
Proud to be a Super User!
Helpful resources

Power BI Monthly Update - November 2025
Check out the November 2025 Power BI update to learn about new features.

Fabric Data Days
Advance your Data & AI career with 50 days of live learning, contests, hands-on challenges, study groups & certifications and more!

| User | Count |
|---|---|
| 97 | |
| 74 | |
| 50 | |
| 48 | |
| 46 |


