
cancel
Showing results for 
Search instead for 
Did you mean: 

July 7 - July 17 | Round 2 of the Power BI Dataviz World Championships. Don't miss your chance! Learn more

Reply
Anonymous
Not applicable

How to create multiple Ranges in Dax (average unit prices)

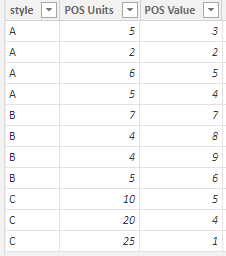
I've got a table with the below headers....

Ukfan123_0-1668730185179.png


I will post a sample file if needed, I just thought this potentially could be easy for the experts here 🙂

All I want to do is create another column that divides the "pos value" by "pos units" for each row (style) which gets me.... "Average Unit Price"

Then I would like another column to allow me to create ranges for this column below

$0-$5
$5.01-$10
$10.01-$20
>$20

My end goal is to compare $ sales from each of these Average Unit Price ranges

1 ACCEPTED SOLUTION
Anonymous
Not applicable

Hi  @Anonymous ,

I created some data:

vyangliumsft_0-1669015261373.png

Here are the steps you can follow:

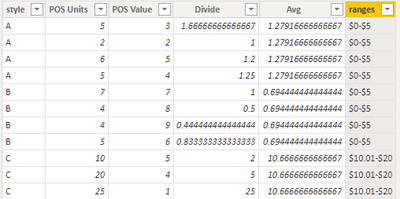
1. Create calculated column.

Divide =
DIVIDE([POS Units],[POS Value])
Avg =
AVERAGEX(FILTER(ALL('Table'),'Table'[style]=EARLIER('Table'[style])),[Divide])
ranges =
SWITCH(
    TRUE(),
    [Avg]>=0&&[Avg]<=5,"$0-$5",
    [Avg]>=5.01&&[Avg]<=10,"$5.01-$10",
    [Avg]>=10.01&&[Avg]<=20,"$10.01-$20",
    ">$20")

2. Result:

vyangliumsft_1-1669015261375.png


Best Regards,

Liu Yang

If this post helps, then please consider Accept it as the solution to help the other members find it more quickly

View solution in original post

2 REPLIES 2
Anonymous
Not applicable

Hi  @Anonymous ,

I created some data:

vyangliumsft_0-1669015261373.png

Here are the steps you can follow:

1. Create calculated column.

Divide =
DIVIDE([POS Units],[POS Value])
Avg =
AVERAGEX(FILTER(ALL('Table'),'Table'[style]=EARLIER('Table'[style])),[Divide])
ranges =
SWITCH(
    TRUE(),
    [Avg]>=0&&[Avg]<=5,"$0-$5",
    [Avg]>=5.01&&[Avg]<=10,"$5.01-$10",
    [Avg]>=10.01&&[Avg]<=20,"$10.01-$20",
    ">$20")

2. Result:

vyangliumsft_1-1669015261375.png


Best Regards,

Liu Yang

If this post helps, then please consider Accept it as the solution to help the other members find it more quickly

amitchandak
Super User
Super User

@Anonymous , Assume you have column price then you van have a new column


Switch( True(),

[Price] <= 5, "  $0-$5",
[Price] <= 10, " $5.01-$10",
[Price] <= 20, "$10.01-$20",
">$20"

)


If you need that on measure refer

Dynamic Segmentation Bucketing Binning
https://community.powerbi.com/t5/Quick-Measures-Gallery/Dynamic-Segmentation-Bucketing-Binning/m-p/1...


Dynamic Segmentation, Bucketing or Binning: https://youtu.be/CuczXPj0N-k

Share with Power BI Enthusiasts: Full Power BI Video (20 Hours) YouTube
Microsoft Fabric Series 60+ Videos YouTube
Microsoft Fabric Hindi End to End YouTube

Helpful resources

Announcements
FabCon and SQLCon Barcelona 2026

FabCon & SQLCon – Barcelona 2026

Join us in Barcelona for FabCon and SQLCon, the Fabric, Power BI, SQL, and AI community event. Save €200 with code FABCMTY200.

60 days of Data Days Carousel

Data Days 2026

Join Fabric Data Days 2026: 60 days of free live/on-demand sessions, challenges, study groups, and certification opportunities.

Power BI DataViz World Championships carousel

Power BI DataViz World Championships - June 2026

A new Power BI DataViz World Championship is coming this June! Don't miss out on submitting your entry.

Top Solution Authors