cancel
Showing results for 
Search instead for 
Did you mean: 

A new Data Days event is coming soon! This time we’re going bigger than ever. Fabric, Power BI, SQL, AI and more. Don't miss out.

Reply
Anonymous
Not applicable

Histogram Graph Chart Help

I am trying to make a power user curve where I look at my data and see what % of my user population completed an activity (Y axis) and how many days of the month did they complete an activity (x axis).  This is COMPLEX and I would love a patient guru's help. This image is the output: Screen Shot 2020-02-05 at 1.42.39 PM.png
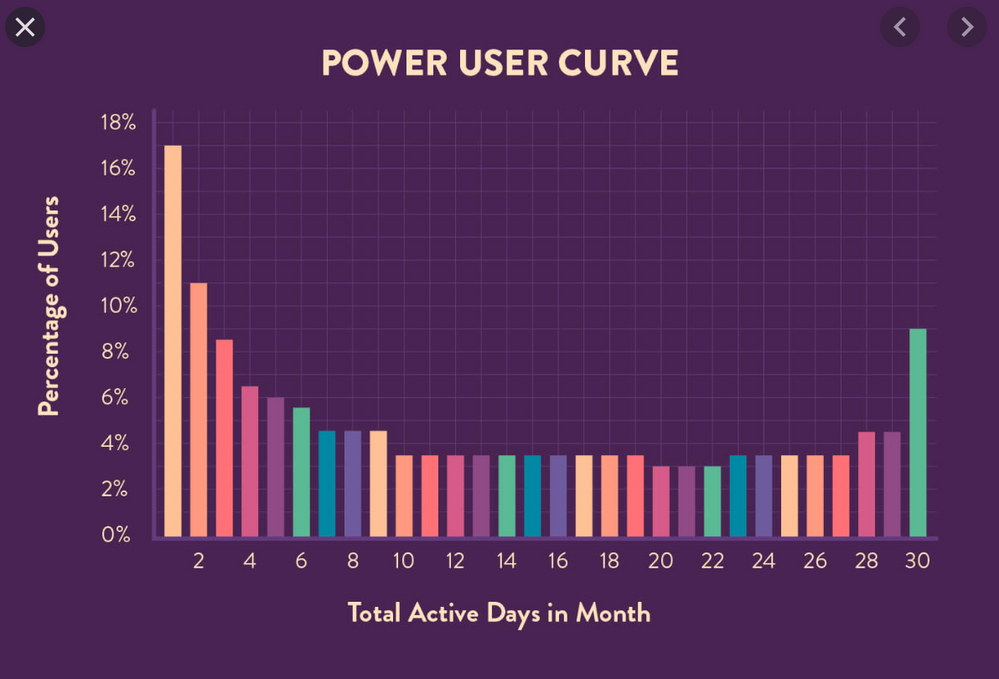
To be clear, the x-axis isn't a calendar date, but a count of the unique days that a given person completed an activity in a given month.

Also, this is for a specific month, not an average of all months 

Also, I am only calculating ActionItemStatus "Completed", not pending. 


I have a data table called Activities:

UserIDActionItemStatusDate
1Completed2/1/2020
2Completed2/1/2020
3Completd2/1/2020
1

Pending

2/1/2020
2

Pending

2/10/2020
3Completed2/10/2020
1Completed2/10/2020
2Completed2/20/2020
3Completed2/20/2020
1

Pending

2/20/2020
2Pending2/22/2020
3Completed2/22/2020
1Pending2/22/2020
2Completed2/22/2020
3Completed2/22/2020
1Completed3/1/2020


Please let me know if you have any ideas of how to solve this. I think the first step of this that would be most helpful, would be to guide me through how to get to the answer of how to create the measures for counting how many days active in a month (how many unique days did a user id complete an action item in the month) and how to show that in a 1,2,3,4,5,6 etc. matrix -- we can get to the graph from there in step 2 potentially? 

2 REPLIES 2
v-juanli-msft
Community Support
Community Support

Hi @Anonymous 

First to calculate how may days every user uses to complete an action item,

we need to recognize different action items for every user, but i can't see any columns regarding the "action item".

if a user needs days which come across different months, how to define the "active days".


It is appreciated of you to share more detailed information.


Best Regards

Maggie

vivran22
Community Champion
Community Champion

Hello @Anonymous ,


You may use following measure:


% Completed =
VAR CompletCount =
    COUNTX (
        FILTER ( dtTable, dtTable[ActionItemStatus] = "Completed" ),
        dtTable[UserID]
    )
VAR Denom =
    CALCULATE ( [Complete Count], ALLSELECTED ( dtTable ) )
VAR _PerCont =
    DIVIDE ( CompletCount, Denom )
RETURN
    _PerCont


Cheers!
Vivek

If it helps, please mark it as a solution
Kudos would be a cherry on the top 🙂

https://www.vivran.in/

Connect on LinkedIn

Helpful resources

Announcements
May Power BI Update Carousel

Power BI Monthly Update - May 2026

Check out the May 2026 Power BI update to learn about new features.

Fabric SQL PBI Data Days

Data Days 2026 coming soon!

Sign up to receive a private message when registration opens and key events begin.

New to Fabric survey Carousel

New to Fabric Survey

If you have recently started exploring Fabric, we'd love to hear how it's going. Your feedback can help with product improvements.

Power BI DataViz World Championships carousel

Power BI DataViz World Championships - June 2026

A new Power BI DataViz World Championship is coming this June! Don't miss out on submitting your entry.