
cancel
Showing results for 
Search instead for 
Did you mean: 

July 7 - July 17 | Round 2 of the Power BI Dataviz World Championships. Don't miss your chance! Learn more

Reply
andreslopezmetl
Regular Visitor

Help with Matrix Visual

Hello all,


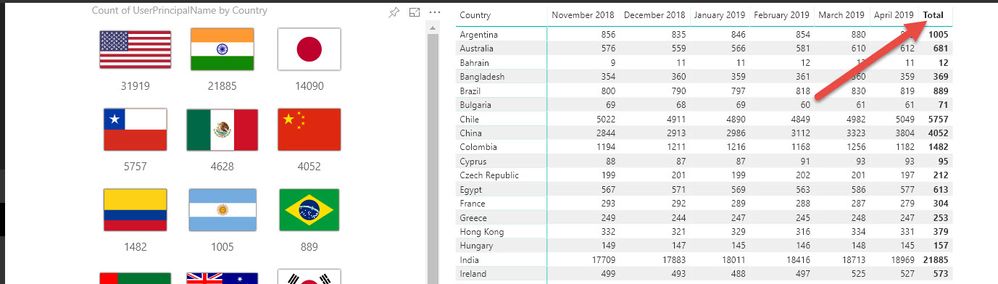
I am using the default Matix visual to display data from a table as you can see below. The Columns show a number for each country per month and i am looking for a way to add a column to this matix that allow me to enter formulas that would calculate YTD growth or month to month difference. Any help would be greatly apprecaited


PowerBI.jpg

2 REPLIES 2
parry2k
Super User
Super User

@andreslopezmetl there are lot of posts/blogs on time calculation, one here.


Subscribe to the @PowerBIHowTo YT channel for an upcoming video on List and Record functions in Power Query!!

Learn Power BI and Fabric - subscribe to our YT channel - Click here: @PowerBIHowTo

If my solution proved useful, I'd be delighted to receive Kudos. When you put effort into asking a question, it's equally thoughtful to acknowledge and give Kudos to the individual who helped you solve the problem. It's a small gesture that shows appreciation and encouragement! ❤


Did I answer your question? Mark my post as a solution. Proud to be a Super User! Appreciate your Kudos 🙂
Feel free to email me with any of your BI needs.

Thank you however i am having a really hard time creating additional columns that would help me determine YTD values. For example below is a  description of my table which has 9 columns and about 500K rows


Capture.PNG


The ReportMonth column has 4 possible values (Jan 2019, Feb 2019, Mar 2019 and Apr 2019). Also values for UserPrincipalName could be present up to 4 times since the data is an append from 4 identical tables from each month. How could i create a formula that would count the instances of each month per country and then the item count difference between each month?


Thank you all

Helpful resources

Announcements
FabCon and SQLCon Barcelona 2026

FabCon & SQLCon – Barcelona 2026

Join us in Barcelona for FabCon and SQLCon, the Fabric, Power BI, SQL, and AI community event. Save €200 with code FABCMTY200.

60 days of Data Days Carousel

Data Days 2026

Join Data Days 2026: 60 days of free live/on-demand sessions, challenges, study groups, and certification opportunities.

Power BI DataViz World Championships carousel

Power BI DataViz World Championships - June 2026

A new Power BI DataViz World Championship is coming this June! Don't miss out on submitting your entry.

Top Solution Authors