
cancel
Showing results for 
Search instead for 
Did you mean: 

July 7 - July 17 | Round 2 of the Power BI Dataviz World Championships. Don't miss your chance! Learn more

Reply
fbostan1
Helper I
Helper I

Help with Matrix Chart

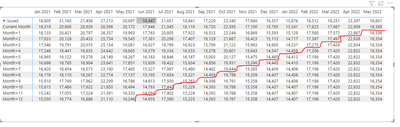
I have this Matrix chart with many measures to get this these numbers, but I only want to show the any data above the red line and hide the ones below the red line., is this possible in PowerBI?

Can someone please help out, Thank you!

fbostan1_0-1655491741494.png


1 ACCEPTED SOLUTION
v-jingzhang
Community Support
Community Support

Hi @fbostan1


Do you have date column or date table in the model? If so, we can consider using date related functions to move back to a previous month end date and compare it with the month value on the column. If you only have YearMonth values in the source table, we need to use other methods. 


For example

New Month+1 = 
var lastMonth = VALUE(FORMAT(EOMONTH(TODAY(),-1),"yyyymm"))
return
IF(MAX('Table'[YearMonth])<=lastMonth,[Month+1],BLANK())

vjingzhang_1-1655802169394.png


You need to modify the code for variable lastMonth in above measure according to your tables. 


Best Regards,
Community Support Team _ Jing
If this post helps, please Accept it as Solution to help other members find it.

View solution in original post

2 REPLIES 2
v-jingzhang
Community Support
Community Support

Hi @fbostan1


Do you have date column or date table in the model? If so, we can consider using date related functions to move back to a previous month end date and compare it with the month value on the column. If you only have YearMonth values in the source table, we need to use other methods. 


For example

New Month+1 = 
var lastMonth = VALUE(FORMAT(EOMONTH(TODAY(),-1),"yyyymm"))
return
IF(MAX('Table'[YearMonth])<=lastMonth,[Month+1],BLANK())

vjingzhang_1-1655802169394.png


You need to modify the code for variable lastMonth in above measure according to your tables. 


Best Regards,
Community Support Team _ Jing
If this post helps, please Accept it as Solution to help other members find it.

speedramps
Super User
Super User

You haven't given enough info for a full answer


I would try get the max possible date for the row and column.

If they are valid then dispaly you old measure, otherwise display blanks.


newmeasure =

//get max date for each column
VAR xdate= MAX(yourtable[xdate])
// get max date for each rown
VAR ydate= MAX(yourtable[ydate])
RETURN
IF(ydate <= xdate, [oldmeasure], BLANK())

Helpful resources

Announcements
FabCon and SQLCon Barcelona 2026

FabCon & SQLCon – Barcelona 2026

Join us in Barcelona for FabCon and SQLCon, the Fabric, Power BI, SQL, and AI community event. Save €200 with code FABCMTY200.

60 days of Data Days Carousel

Data Days 2026

Join Fabric Data Days 2026: 60 days of free live/on-demand sessions, challenges, study groups, and certification opportunities.

Power BI DataViz World Championships carousel

Power BI DataViz World Championships - June 2026

A new Power BI DataViz World Championship is coming this June! Don't miss out on submitting your entry.