FabCon is coming to Atlanta
Join us at FabCon Atlanta from March 16 - 20, 2026, for the ultimate Fabric, Power BI, AI and SQL community-led event. Save $200 with code FABCOMM.
Register now!- Power BI forums
- Get Help with Power BI
- Desktop
- Service
- Report Server
- Power Query
- Mobile Apps
- Developer
- DAX Commands and Tips
- Custom Visuals Development Discussion
- Health and Life Sciences
- Power BI Spanish forums
- Translated Spanish Desktop
- Training and Consulting
- Instructor Led Training
- Dashboard in a Day for Women, by Women
- Galleries
- Data Stories Gallery
- Themes Gallery
- Contests Gallery
- QuickViz Gallery
- Quick Measures Gallery
- Visual Calculations Gallery
- Notebook Gallery
- Translytical Task Flow Gallery
- TMDL Gallery
- R Script Showcase
- Webinars and Video Gallery
- Ideas
- Custom Visuals Ideas (read-only)
- Issues
- Issues
- Events
- Upcoming Events
The Power BI Data Visualization World Championships is back! Get ahead of the game and start preparing now! Learn more
- Power BI forums
- Forums
- Get Help with Power BI
- Desktop
- IF Statement - Custom Column + Measure
- Subscribe to RSS Feed
- Mark Topic as New
- Mark Topic as Read
- Float this Topic for Current User
- Bookmark
- Subscribe
- Printer Friendly Page
- Mark as New
- Bookmark
- Subscribe
- Mute
- Subscribe to RSS Feed
- Permalink
- Report Inappropriate Content
IF Statement - Custom Column + Measure
Hi all,
I have a table where the second last column (Total number of products launched) is a custom column, and the last column (number of products launched for the selected years) is a calculated measure using DAX language and it is the one that can adapt to the selected years filter.
My goal is to add add a flag as a column/ calculated DAX measure with a condition, if the last 2 columns in the table are the same - the returning value is True otherwise, False. However, using a true or false column is displaying the same information: True.
Please help! Thank you.
Solved! Go to Solution.
- Mark as New
- Bookmark
- Subscribe
- Mute
- Subscribe to RSS Feed
- Permalink
- Report Inappropriate Content
Hi @Anonymous ,
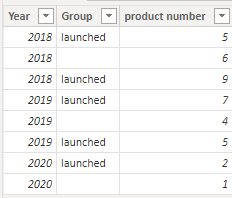
I created some data:
Here are the steps you can follow:
1. Create calculated column.
Total number of products launched_Column =
SUMX(FILTER(ALL('Table'),'Table'[Group]="launched"),[product number])
2. Create measure.
number of products launched for the selected years =
var _select=SELECTEDVALUE('Table'[Year])
return
SUMX(FILTER(ALL('Table'),'Table'[Group]="launched"&&'Table'[Year]<=_select),[product number])
Flag =
IF(
MAX('Table'[Total number of products launched_Column])=[number of products launched for the selected years],"True","False")Flag1 =
IF(
ISERROR(
SEARCH("True",[Flag]))
,
"true",
[Flag]
)
3. Result:
Best Regards,
Liu Yang
If this post helps, then please consider Accept it as the solution to help the other members find it more quickly
- Mark as New
- Bookmark
- Subscribe
- Mute
- Subscribe to RSS Feed
- Permalink
- Report Inappropriate Content
Hi @Anonymous
Could you please supply your PBIX file or some sample data and examples of your table visual. Really hard to get my head around this without seeing your data, your measure etc.
regards
Phil
Did I answer your question? Then please mark my post as the solution.
If I helped you, click on the Thumbs Up to give Kudos.
Blog :: YouTube Channel :: Connect on Linkedin
Proud to be a Super User!
Helpful resources

Power BI Dataviz World Championships
The Power BI Data Visualization World Championships is back! Get ahead of the game and start preparing now!

| User | Count |
|---|---|
| 40 | |
| 36 | |
| 33 | |
| 29 | |
| 26 |
| User | Count |
|---|---|
| 134 | |
| 103 | |
| 63 | |
| 60 | |
| 55 |


