cancel
Showing results for 
Search instead for 
Did you mean: 

July 7 - July 17 | Round 2 of the Power BI Dataviz World Championships. Don't miss your chance! Learn more

Reply
braybrookj
Advocate I
Advocate I

Help: Text Cleansing with R

Hi Guys,


I'm trying to cleanse my data in Power BI with R. The data comes from a SQL query and then in power query I'm using the "Run R Script" as a final step.

I have 6 columns of data (Score [int], Date [date], Comments [varchar(max)], username [varchar(20)], Language [varchar(20)] and Source [int].


I'm new to R so this could be simple or I may be barking up the wrong tree completely. The R script I have attempted is:

# 'dataset' holds the input data for this script
library(tm)
library(wordcloud)
words <- Corpus(VectorSource(dataset[,3]))
words <- tm_map(words, stripWhitespace)
words <- tm_map(words, content_transformer(tolower))
words <- tm_map(words, removeNumbers)
words <- tm_map(words, removePunctuation)
words <- tm_map(words, removeWords, stopwords("english"))
words <- tm_map(words, stemDocument)
output <- dataset
output$cleansed <- words

It outputs all original columns as per before the R Script EXCEPT the date column which returns "Microsoft.OleDb.Date" for every value. The final column "Cleansed" just returns null.


Any ideas on what needs to be changed to get this to work?


Cheers

3 REPLIES 3
alanhodgson
Solution Supplier
Solution Supplier

Hey @braybrookj,


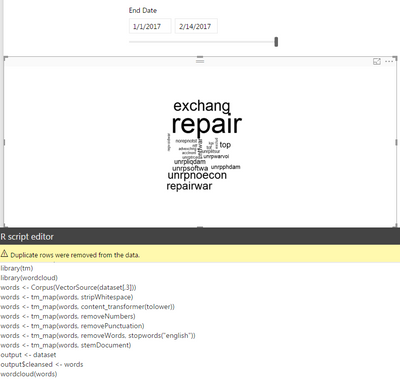
I just used the code above and had no issues creating the visual (see below). What is the date column formatting? Mine is formatted as data type Date, format M/d/yyyy, "Do Not Summarize".


wordcloud.PNG


Hope this helps,


Alan

Hi @alanhodgson


Thanks for the response.

The issue I have is that I publish a data model to the service and build a collection of reports in the based off a common data model. R Visuals cannot be created in the service.

I'm trying to use the R script in power query to cleanse the data within teh data model and then use the Wordcloud custom visual.


Any thoughts on this process?


James

UPDATE


I have overcome the formatting issue by making every column text before running the R scipt, I will then re-format the columns after the script has run.

I'm still having issues with the script though:

# 'dataset' holds the input data for this script
library(tm)
library(wordcloud)
words <- Corpus(VectorSource(dataset[,3]))
words <- tm_map(words, stripWhitespace)
words <- tm_map(words, content_transformer(tolower))
words <- tm_map(words, removeNumbers)
words <- tm_map(words, removePunctuation)
words <- tm_map(words, removeWords, stopwords("english"))
output <- dataset
output$text <- data.frame(text = sapply(words, as.character), stringsAsFactors = FALSE)

The output i get is my original 6 columns, plus a 7th column named "text". This column however is populated with null except for the first row which has an error.

DataFormat.Error: We cannot convert this value from its .RData representation.

Helpful resources

Announcements
FabCon and SQLCon Barcelona 2026

FabCon & SQLCon – Barcelona 2026

Join us in Barcelona for FabCon and SQLCon, the Fabric, Power BI, SQL, and AI community event. Save €200 with code FABCMTY200.

60 days of Data Days Carousel

Data Days 2026

Join Data Days 2026: 60 days of free live/on-demand sessions, challenges, study groups, and certification opportunities.

Power BI DataViz World Championships carousel

Power BI DataViz World Championships - June 2026

A new Power BI DataViz World Championship is coming this June! Don't miss out on submitting your entry.

Top Solution Authors