FabCon is coming to Atlanta
Join us at FabCon Atlanta from March 16 - 20, 2026, for the ultimate Fabric, Power BI, AI and SQL community-led event. Save $200 with code FABCOMM.
Register now!- Power BI forums
- Get Help with Power BI
- Desktop
- Service
- Report Server
- Power Query
- Mobile Apps
- Developer
- DAX Commands and Tips
- Custom Visuals Development Discussion
- Health and Life Sciences
- Power BI Spanish forums
- Translated Spanish Desktop
- Training and Consulting
- Instructor Led Training
- Dashboard in a Day for Women, by Women
- Galleries
- Data Stories Gallery
- Themes Gallery
- Contests Gallery
- QuickViz Gallery
- Quick Measures Gallery
- Visual Calculations Gallery
- Notebook Gallery
- Translytical Task Flow Gallery
- TMDL Gallery
- R Script Showcase
- Webinars and Video Gallery
- Ideas
- Custom Visuals Ideas (read-only)
- Issues
- Issues
- Events
- Upcoming Events
The Power BI Data Visualization World Championships is back! It's time to submit your entry. Live now!
- Power BI forums
- Forums
- Get Help with Power BI
- Desktop
- Re: Help Filtering
- Subscribe to RSS Feed
- Mark Topic as New
- Mark Topic as Read
- Float this Topic for Current User
- Bookmark
- Subscribe
- Printer Friendly Page
- Mark as New
- Bookmark
- Subscribe
- Mute
- Subscribe to RSS Feed
- Permalink
- Report Inappropriate Content
Help Filtering
Hi all,
I'm having trouble filtering a table.
I have a table that lists customers and their purchase dates. The goal is to show how many customers bought in 2018, how many bought in 2019, and then who bought in 2018 but hasn't bought in 2019.
Sample table time:
| Customer | Purchase Date |
| Bob | 2019 |
| Bob | 2018 |
| Jane | 2018 |
| Mary | 2019 |
| Mary | 2019 |
| Joe | 2019 |
| Joe | 2018 |
| Joe | 2019 |
| Joe | 2018 |
| Mary | 2019 |
| Mary | 2018 |
| Jane | 2018 |
In this case I can filter a table of only 2018 purchases and another filtered table of only 2019 purchases by doing something like:
2018 = FILTER('Table1', YEAR('Table1'[Purchasedate])=2018)
I don't know how to get a table that will end up looking like this:
| Customer | Purchase Date |
| Jane | 2018 |
| Jane | 2018 |
This is sample data, the actual originial data has 320k orders across 2 years with 721 distinct customers so it's a bit unweildly to do by hand.
Thanks in advance!
Solved! Go to Solution.
- Mark as New
- Bookmark
- Subscribe
- Mute
- Subscribe to RSS Feed
- Permalink
- Report Inappropriate Content
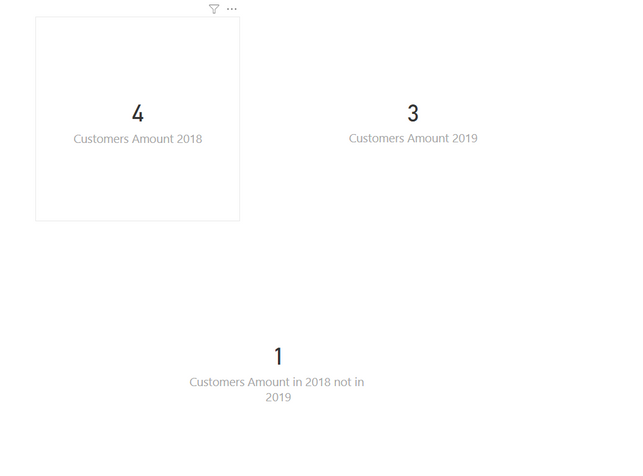
You can create two measures to achieve amount in 2018 and 2019 seprately:
Customers Amount 2018 = CALCULATE(DISTINCTCOUNT('Table'[Customer]), FILTER('Table', 'Table'[Purchase Date] = 2018))

Customers Amount 2019 = CALCULATE(DISTINCTCOUNT('Table'[Customer]), FILTER('Table', 'Table'[Purchase Date] = 2019))
Then you can create a temp table via click "New Table" using DAX below:
Customers Amount in 2018 not in 2019 =
VAR Table_2018 = SUMMARIZE(FILTER(ALL('Table'), 'Table'[Purchase Date] = 2018), 'Table'[Customer])
VAR Table_2019 = SUMMARIZE(FILTER(ALL('Table'), 'Table'[Purchase Date] = 2019), 'Table'[Customer])
RETURN
ADDCOLUMNS(EXCEPT(Table_2018, Table_2019), "Date", 2018)

Finanly, create a measure to count customers who purchased in 2018 but not purchased in 2019 in the new temp table:
Customers Amount in 2018 not in 2019 = COUNTROWS('Customers Amount in 2018 not in 2019')
You may also refer to pbix attached.
Community Support Team _ Jimmy Tao
If this post helps, then please consider Accept it as the solution to help the other members find it more quickly.
- Mark as New
- Bookmark
- Subscribe
- Mute
- Subscribe to RSS Feed
- Permalink
- Report Inappropriate Content
You can create two measures to achieve amount in 2018 and 2019 seprately:
Customers Amount 2018 = CALCULATE(DISTINCTCOUNT('Table'[Customer]), FILTER('Table', 'Table'[Purchase Date] = 2018))

Customers Amount 2019 = CALCULATE(DISTINCTCOUNT('Table'[Customer]), FILTER('Table', 'Table'[Purchase Date] = 2019))
Then you can create a temp table via click "New Table" using DAX below:
Customers Amount in 2018 not in 2019 =
VAR Table_2018 = SUMMARIZE(FILTER(ALL('Table'), 'Table'[Purchase Date] = 2018), 'Table'[Customer])
VAR Table_2019 = SUMMARIZE(FILTER(ALL('Table'), 'Table'[Purchase Date] = 2019), 'Table'[Customer])
RETURN
ADDCOLUMNS(EXCEPT(Table_2018, Table_2019), "Date", 2018)

Finanly, create a measure to count customers who purchased in 2018 but not purchased in 2019 in the new temp table:
Customers Amount in 2018 not in 2019 = COUNTROWS('Customers Amount in 2018 not in 2019')
You may also refer to pbix attached.
Community Support Team _ Jimmy Tao
If this post helps, then please consider Accept it as the solution to help the other members find it more quickly.
- Mark as New
- Bookmark
- Subscribe
- Mute
- Subscribe to RSS Feed
- Permalink
- Report Inappropriate Content
Thanks!
Helpful resources

Power BI Dataviz World Championships
The Power BI Data Visualization World Championships is back! It's time to submit your entry.

Power BI Monthly Update - January 2026
Check out the January 2026 Power BI update to learn about new features.

| User | Count |
|---|---|
| 56 | |
| 42 | |
| 40 | |
| 21 | |
| 20 |
| User | Count |
|---|---|
| 150 | |
| 106 | |
| 65 | |
| 36 | |
| 36 |

