cancel
Showing results for 
Search instead for 
Did you mean: 

July 7 - July 17 | Round 2 of the Power BI Dataviz World Championships. Don't miss your chance! Learn more

Reply
anacerco
Frequent Visitor

Grouping Values

Hello.


I need help on this. I want to create group ranges based on the purchase amount of each market. I have this table:


Market  Transaction amount Date

Brazil      BRL 100                   1/8

Brazil      BRL 50                     1/8

Brazil      BRL 180                    2/8

Canada   CAD 25                     1/8

US           USD 10                     1/8


I want to create ranges for each market such as


Brazil Ranges   Count

1-100                   2

100-200               1


Canada Ranges  Count

1-50                     1


The idea is to that I can have a filter for Market so that if I click on BRAZIL it appears the table for ranges for Brazil.

Can anyone help me on this?


Thank you.


1 ACCEPTED SOLUTION
v-yulgu-msft
Microsoft Employee
Microsoft Employee

Hi @anacerco,


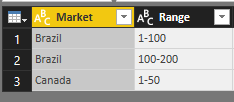
How do you define the group ranges? Are they pre-defined in data source? I mean there existing a table like below:

4.PNG


After loading into desktop, please locate to Query Editor mode first.

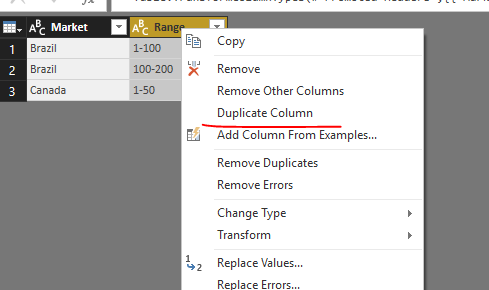
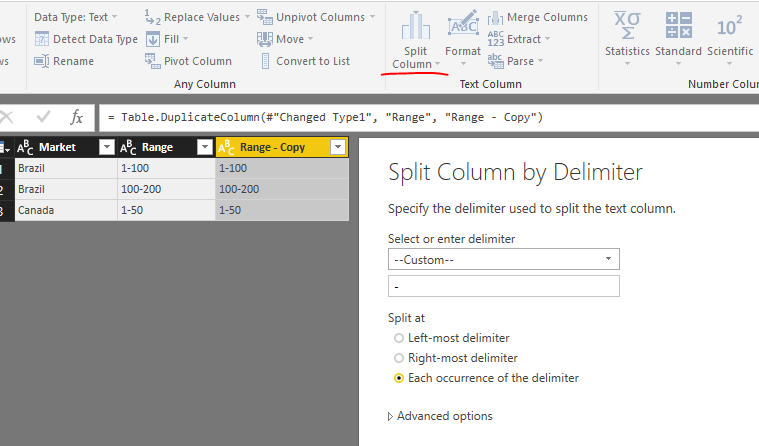
Right click and duplicate the [Range] column and then split the duplicated one.

1.PNG2.PNG


Save above changes. In report view, please new below measure:

count =
CALCULATE (
    COUNT ( Dataset1[Transaction] ),
    FILTER (
        Dataset1,
        Dataset1[Market] = SELECTEDVALUE ( Dataset2[Market] )
            && Dataset1[Amount] >= SELECTEDVALUE ( Dataset2[Min] )
            && Dataset1[Amount] < SELECTEDVALUE ( Dataset2[Max] )
    )
)

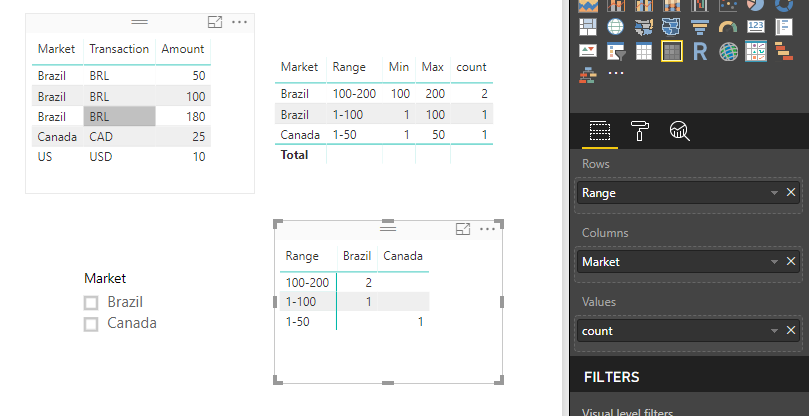
Then, use a Matrix visual to display data.

3.PNG


Best regards,

Yuliana Gu

Community Support Team _ Yuliana Gu
If this post helps, then please consider Accept it as the solution to help the other members find it more quickly.

View solution in original post

3 REPLIES 3
v-yulgu-msft
Microsoft Employee
Microsoft Employee

Hi @anacerco,


How do you define the group ranges? Are they pre-defined in data source? I mean there existing a table like below:

4.PNG


After loading into desktop, please locate to Query Editor mode first.

Right click and duplicate the [Range] column and then split the duplicated one.

1.PNG2.PNG


Save above changes. In report view, please new below measure:

count =
CALCULATE (
    COUNT ( Dataset1[Transaction] ),
    FILTER (
        Dataset1,
        Dataset1[Market] = SELECTEDVALUE ( Dataset2[Market] )
            && Dataset1[Amount] >= SELECTEDVALUE ( Dataset2[Min] )
            && Dataset1[Amount] < SELECTEDVALUE ( Dataset2[Max] )
    )
)

Then, use a Matrix visual to display data.

3.PNG


Best regards,

Yuliana Gu

Community Support Team _ Yuliana Gu
If this post helps, then please consider Accept it as the solution to help the other members find it more quickly.

Hello Yuliana,


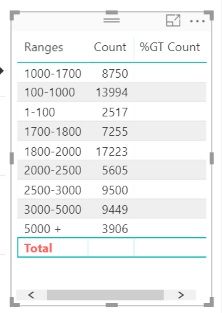
I just found that I am not being able to show the total for this ranges. I would like to have the total for all the ranges and also a column showing the % that each range has on the total, but somehow when I add a new column of count and click on "show as grand total" is not showing anything. Do you know how can I solve this?


count .jpg


thank you!


Hello Yuliana,


Thanks for your help. I managed to follow your steps and worked!


Helpful resources

Announcements
FabCon and SQLCon Barcelona 2026

FabCon & SQLCon – Barcelona 2026

Join us in Barcelona for FabCon and SQLCon, the Fabric, Power BI, SQL, and AI community event. Save €200 with code FABCMTY200.

60 days of Data Days Carousel

Data Days 2026

Join Data Days 2026: 60 days of free live/on-demand sessions, challenges, study groups, and certification opportunities.

Power BI DataViz World Championships carousel

Power BI DataViz World Championships - June 2026

A new Power BI DataViz World Championship is coming this June! Don't miss out on submitting your entry.

Top Solution Authors