FabCon is coming to Atlanta
Join us at FabCon Atlanta from March 16 - 20, 2026, for the ultimate Fabric, Power BI, AI and SQL community-led event. Save $200 with code FABCOMM.
Register now!- Power BI forums
- Get Help with Power BI
- Desktop
- Service
- Report Server
- Power Query
- Mobile Apps
- Developer
- DAX Commands and Tips
- Custom Visuals Development Discussion
- Health and Life Sciences
- Power BI Spanish forums
- Translated Spanish Desktop
- Training and Consulting
- Instructor Led Training
- Dashboard in a Day for Women, by Women
- Galleries
- Data Stories Gallery
- Themes Gallery
- Contests Gallery
- Quick Measures Gallery
- Visual Calculations Gallery
- Notebook Gallery
- Translytical Task Flow Gallery
- TMDL Gallery
- R Script Showcase
- Webinars and Video Gallery
- Ideas
- Custom Visuals Ideas (read-only)
- Issues
- Issues
- Events
- Upcoming Events
Calling all Data Engineers! Fabric Data Engineer (Exam DP-700) live sessions are back! Starting October 16th. Sign up.
- Power BI forums
- Forums
- Get Help with Power BI
- Desktop
- Re: Graph with sum line
- Subscribe to RSS Feed
- Mark Topic as New
- Mark Topic as Read
- Float this Topic for Current User
- Bookmark
- Subscribe
- Printer Friendly Page
- Mark as New
- Bookmark
- Subscribe
- Mute
- Subscribe to RSS Feed
- Permalink
- Report Inappropriate Content
Graph with sum line
Good morning!
I need a help, I'm developing a report where the graph showed me the total of admitted per month,
I would like to know how to do it, add up the values from the previous months, to bring me a line that demonstrates the total of employees of the company.
Thank you very much in advance,
Att,
Solved! Go to Solution.
- Mark as New
- Bookmark
- Subscribe
- Mute
- Subscribe to RSS Feed
- Permalink
- Report Inappropriate Content
This is a classic problem that I have seen a few times, the solution is to create an "active employees" measure with a disconnected Calendar.
To do this you will need a Calendar table with contigeous days in it.
The fastest way to do this is create a new table
Calendar = CALENDARAUTO()... this will scan your data and build table with a list of dates. I recommend you build a proper date dimension but this does the trick.
This Calendar[Date] is used to slice the data, no relationships are needed as we build a measure to lookup the value.
Then your employee count measure:
Employees = DISTINCTCOUNT(Table1[EmployeeID])
Then you need a measure that counts the employees whose "admission date" is before (<=) the last date in the selected period and "termination date" is after the first date in the selected date period
CALCULATE([Employees], FILTER(Table1, (Table1[Admission Date] <= LASTDATE (Calendar[Date])) && (Table1[DismissalDate] >= FIRSTDATE(Calendar[Date]))))
- Mark as New
- Bookmark
- Subscribe
- Mute
- Subscribe to RSS Feed
- Permalink
- Report Inappropriate Content
You can create a measure like:
Measure = CALCULATE(SUM([Value]),ALL(Table))
Then just add this as a Value in your chart.
Follow on LinkedIn
@ me in replies or I'll lose your thread!!!
Instead of a Kudo, please vote for this idea
Become an expert!: Enterprise DNA
External Tools: MSHGQM
YouTube Channel!: Microsoft Hates Greg
Latest book!: DAX For Humans
DAX is easy, CALCULATE makes DAX hard...
- Mark as New
- Bookmark
- Subscribe
- Mute
- Subscribe to RSS Feed
- Permalink
- Report Inappropriate Content
Thank you for your help,
One more doubt is it possible to perform some calculation (admissions / layoffs) to show the growth of the company in the chart?
- Mark as New
- Bookmark
- Subscribe
- Mute
- Subscribe to RSS Feed
- Permalink
- Report Inappropriate Content
That would depend on your data and the format of that data. But, yes, if you have a list of people who have left, then you should be able to perform that calculation. Can you show some example data?
Follow on LinkedIn
@ me in replies or I'll lose your thread!!!
Instead of a Kudo, please vote for this idea
Become an expert!: Enterprise DNA
External Tools: MSHGQM
YouTube Channel!: Microsoft Hates Greg
Latest book!: DAX For Humans
DAX is easy, CALCULATE makes DAX hard...
- Mark as New
- Bookmark
- Subscribe
- Mute
- Subscribe to RSS Feed
- Permalink
- Report Inappropriate Content
Yes I can,
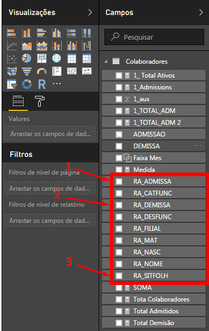
In this image below, inside the "square" are the fields of the database.
1. date of admission (ex: 20170130)
2. Date of dismissal (ex: 20170130)
3. Payroll situation (D = Dismissed or EMPTY = active)
The other fields are "measures"
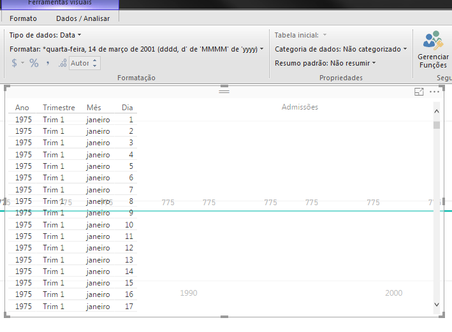
In this image, it correctly displays the total number of employees I have active today, but it does not change according to the date.
obs. We created measure for dates of admission and dismissal by changing the "field format" to date
If you need more information please let me know,
Thank you for the great help,
- Mark as New
- Bookmark
- Subscribe
- Mute
- Subscribe to RSS Feed
- Permalink
- Report Inappropriate Content
This is a classic problem that I have seen a few times, the solution is to create an "active employees" measure with a disconnected Calendar.
To do this you will need a Calendar table with contigeous days in it.
The fastest way to do this is create a new table
Calendar = CALENDARAUTO()... this will scan your data and build table with a list of dates. I recommend you build a proper date dimension but this does the trick.
This Calendar[Date] is used to slice the data, no relationships are needed as we build a measure to lookup the value.
Then your employee count measure:
Employees = DISTINCTCOUNT(Table1[EmployeeID])
Then you need a measure that counts the employees whose "admission date" is before (<=) the last date in the selected period and "termination date" is after the first date in the selected date period
CALCULATE([Employees], FILTER(Table1, (Table1[Admission Date] <= LASTDATE (Calendar[Date])) && (Table1[DismissalDate] >= FIRSTDATE(Calendar[Date]))))
- Mark as New
- Bookmark
- Subscribe
- Mute
- Subscribe to RSS Feed
- Permalink
- Report Inappropriate Content
Hi joubertsaquett
I think you just need to use ALL to remove the filters and show the total.
Measures:
Admissions = SUM(Table1[Admissions])
All admissions = CALCULATE([Admissions],ALL(Table1))
This will always return the total admissions from all data/time
- Mark as New
- Bookmark
- Subscribe
- Mute
- Subscribe to RSS Feed
- Permalink
- Report Inappropriate Content
Thank you, I'll take the test!
Helpful resources

FabCon Global Hackathon
Join the Fabric FabCon Global Hackathon—running virtually through Nov 3. Open to all skill levels. $10,000 in prizes!

Power BI Monthly Update - October 2025
Check out the October 2025 Power BI update to learn about new features.


