cancel
Showing results for 
Search instead for 
Did you mean: 

Level up your Power BI skills this month - build one visual each week and tell better stories with data! Get started

Reply
LairdLight
Frequent Visitor

Trying to achieve a filter equivalent to multiple relationships

Hi - I'm not sure if what I'm trying to do is achievable, I'm a novice at any kind of coding so any kind of help would be much appreciated....


I have a table with unique 'Application Group' values like this:

AppGroupSMEPhase
xJohn1
yLaura2
zSteve3


I then have a table with a row per integration between a source 'Application Group' and a destination 'Application Group' field, both of which are derived from the same 'Application Group' filed in the first table. Like this:


IntegrationSourceAppGroupDestinationAppGroup
d1xy
f1yx
f2yz
h7zx


I want to be able to filter my second table (and any associated visuals) using the application group field in the first table - where an application group appears as either a source or a destination. I've tried a few things but nothing I'm trying seems to work.


Thanks 

1 ACCEPTED SOLUTION
Phil_Seamark
Microsoft Employee
Microsoft Employee

Hi @LairdLight


This is a little rough but might be ok.


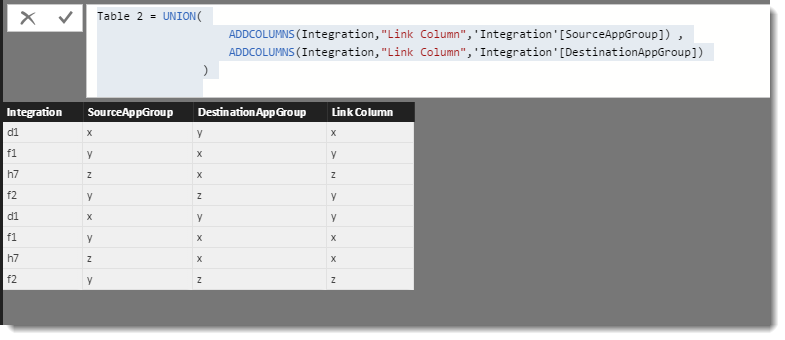
I created a new table based on your 2nd table but doubled the rows and introduced a Link column


Table 2 = UNION(
                    ADDCOLUMNS(Integration,"Link Column",'Integration'[SourceAppGroup]) ,
                    ADDCOLUMNS(Integration,"Link Column",'Integration'[DestinationAppGroup])
                )
				

This generates the following based on your sample data


multi join.png

I could then create a relationship from the new table to the slicer table using the new Link Column


link.png


Now on my report page, if I use a slicer over the Application Group, my visual based on the new table responds they way I think  you want it to.


slicer.png


To learn more about DAX visit : aka.ms/practicalDAX

Proud to be a Datanaut!

View solution in original post

2 REPLIES 2
Phil_Seamark
Microsoft Employee
Microsoft Employee

Hi @LairdLight


This is a little rough but might be ok.


I created a new table based on your 2nd table but doubled the rows and introduced a Link column


Table 2 = UNION(
                    ADDCOLUMNS(Integration,"Link Column",'Integration'[SourceAppGroup]) ,
                    ADDCOLUMNS(Integration,"Link Column",'Integration'[DestinationAppGroup])
                )
				

This generates the following based on your sample data


multi join.png

I could then create a relationship from the new table to the slicer table using the new Link Column


link.png


Now on my report page, if I use a slicer over the Application Group, my visual based on the new table responds they way I think  you want it to.


slicer.png


To learn more about DAX visit : aka.ms/practicalDAX

Proud to be a Datanaut!

Hi @Phil_Seamark


I've just applied your suggestion in my data model and it's definitely achieving the result I was aiming for.


Thanks very much for taking the time to solve this, much appreciated.

Helpful resources

Announcements
April Power BI Update Carousel

Power BI Monthly Update - April 2026

Check out the April 2026 Power BI update to learn about new features.

Fabric SQL PBI Data Days

Data Days 2026 coming soon!

Sign up to receive a private message when registration opens and key events begin.

New to Fabric survey Carousel

New to Fabric Survey

If you have recently started exploring Fabric, we'd love to hear how it's going. Your feedback can help with product improvements.

Power BI DataViz World Championships carousel

Power BI DataViz World Championships - June 2026

A new Power BI DataViz World Championship is coming this June! Don't miss out on submitting your entry.