This time we’re going bigger than ever. Fabric, Power BI, SQL, AI and more. We're covering it all. You won't want to miss it.
Learn moreLevel up your Power BI skills this month - build one visual each week and tell better stories with data! Get started
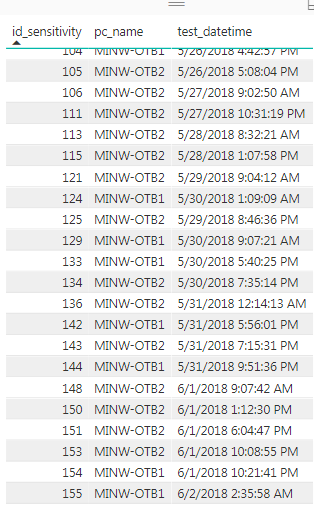
I'd like to create a line graph that shows total cumulative count of occurences of a string (pc_name).
I can find a lot of exampels of this with numbers. But I can't figure it out with a string. I'm new to power BI, and am getting a little frustrated.
Any advice?
Solved! Go to Solution.
Hi, Lets try with:
1. Create a New Table With Distinct IDs
Modeling - New Table
Tableid = DISTINCT(Table1[ID])
2. Create a measure:
Count of pc_name running total =
CALCULATE (
COUNTA ( 'Table1'[pc_name] ),
FILTER ( ALLSELECTED ( 'Tableid'[ID] ), Tableid[ID] <= MAX ( Tableid[ID] ) )
)
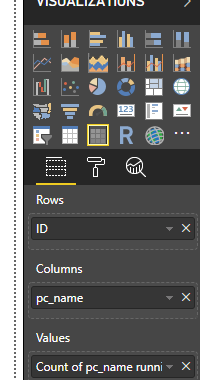
+ 03. In a Matrix Visual :
ID from Table ID
4. Ready
VV
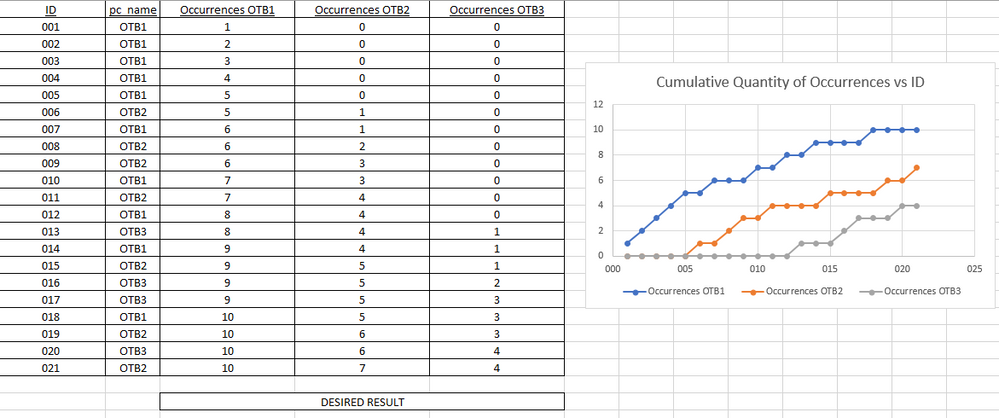
Below is an example created in Exel. Can this be recreated in Power BI?
Hi, Lets try with:
1. Create a New Table With Distinct IDs
Modeling - New Table
Tableid = DISTINCT(Table1[ID])
2. Create a measure:
Count of pc_name running total =
CALCULATE (
COUNTA ( 'Table1'[pc_name] ),
FILTER ( ALLSELECTED ( 'Tableid'[ID] ), Tableid[ID] <= MAX ( Tableid[ID] ) )
)
+ 03. In a Matrix Visual :
ID from Table ID
4. Ready
VV
This worked great. Thank you for taking time out of your day to help an internet stranger. I appreciate it!
Check out the April 2026 Power BI update to learn about new features.
Sign up to receive a private message when registration opens and key events begin.
If you have recently started exploring Fabric, we'd love to hear how it's going. Your feedback can help with product improvements.
| User | Count |
|---|---|
| 35 | |
| 32 | |
| 25 | |
| 22 | |
| 18 |
| User | Count |
|---|---|
| 65 | |
| 35 | |
| 32 | |
| 25 | |
| 23 |