cancel
Showing results for 
Search instead for 
Did you mean: 

July 7 - July 17 | Round 2 of the Power BI Dataviz World Championships. Don't miss your chance! Learn more

Reply
Anonymous
Not applicable

Frequency

Hello, can anybody help me? I dont even know where to start 😞


Situation:

thats not the real table because i cant share the information, but is something like this:


CostumerProductDate
Costumer 1   Product x   01/10/2021
Costumer 2   Product x01/10/2021
Costumer 1Product x  01/10/2021
Costumer 1Product x  01/09/2021
Costumer 1Product x  01/08/2021
Costumer 2Product x  10/10/2021
Costumer 3Product x  05/09/2021
Costumer 3Product x  10/08/2021
Costumer 3Product x  07/07/2021
Costumer 3Product x  01/11/2021


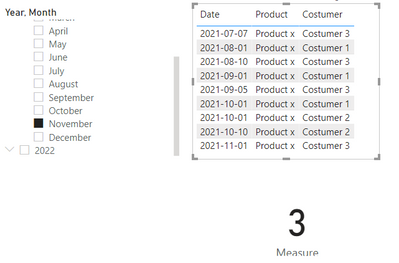
and the output would be: 

When i select a month the card visualization will show how many costumers purchased at 3 differents months in the last 5 months (if i select july for example it will be the 5 months before july)


For example (for this data table): 

If i select november, the measure will return 2 costumers, because between november and june 2 costumers purchased in 3 differents months. 


Thank you very much!!


PS: sorry for my english, i'm brazilian

1 ACCEPTED SOLUTION
v-xiaotang
Community Support
Community Support

Hi @Anonymous 

try this measure,

Measure = 
    var _date=DATE(MAX('Calendar'[Date].[Year]),MAX('Calendar'[Date].[MonthNo]),1)
    var _start=EOMONTH(_date,-5)
    var _end=EOMONTH(_date,0)
return IF(ISFILTERED('Calendar'[Date].[Month]),CALCULATE(DISTINCTCOUNT('Table'[Costumer]),FILTER(ALL('Table'),'Table'[Date]<=_end&&'Table'[Date]>_start)),BLANK())

result

vxiaotang_0-1638518131719.png

Best Regards,

Community Support Team _Tang

If this post helps, please consider Accept it as the solution to help the other members find it more quickly.

View solution in original post

2 REPLIES 2
v-xiaotang
Community Support
Community Support

Hi @Anonymous 

try this measure,

Measure = 
    var _date=DATE(MAX('Calendar'[Date].[Year]),MAX('Calendar'[Date].[MonthNo]),1)
    var _start=EOMONTH(_date,-5)
    var _end=EOMONTH(_date,0)
return IF(ISFILTERED('Calendar'[Date].[Month]),CALCULATE(DISTINCTCOUNT('Table'[Costumer]),FILTER(ALL('Table'),'Table'[Date]<=_end&&'Table'[Date]>_start)),BLANK())

result

vxiaotang_0-1638518131719.png

Best Regards,

Community Support Team _Tang

If this post helps, please consider Accept it as the solution to help the other members find it more quickly.

amitchandak
Super User
Super User

@Anonymous , Use date tbale, join with date. Add month year column in table


New column

Month year = format([Date], "YYYYMM")


Measures
Rolling 5= CALCULATE(DistinctCount('Table'[Month Year]),DATESINPERIOD('Date'[Date ],MAX('Date'[Date ]),-5,MONTH))

Min 3 Months = countx(filter(values(Table[Customer]), [Rolling 5] >=3), [Customer])

Share with Power BI Enthusiasts: Full Power BI Video (20 Hours) YouTube
Microsoft Fabric Series 60+ Videos YouTube
Microsoft Fabric Hindi End to End YouTube

Helpful resources

Announcements
FabCon and SQLCon Barcelona 2026

FabCon & SQLCon – Barcelona 2026

Join us in Barcelona for FabCon and SQLCon, the Fabric, Power BI, SQL, and AI community event. Save €200 with code FABCMTY200.

60 days of Data Days Carousel

Data Days 2026

Join Data Days 2026: 60 days of free live/on-demand sessions, challenges, study groups, and certification opportunities.

Power BI DataViz World Championships carousel

Power BI DataViz World Championships - June 2026

A new Power BI DataViz World Championship is coming this June! Don't miss out on submitting your entry.

Top Solution Authors
Top Kudoed Authors